Last Updated on March 12, 2024 by Lukas Rieder
Profitability refers to earning power, i.e., the ability to generate recurring profits in the short and long term. From a holistic perspective, profitability has two main elements: profitability and productivity.
Profitability
A ratio of two value measures, e.g., earnings before interest and taxes (EBIT) divided by assets used to generate EBIT (return on assets or return on investment ROI). Because in Management Control the inner workings of a company are the starting point, we deliberately refer to return on assets, because it is the use of assets that generates profitability. The return on capital is the view of the financiers.
The ratio ROI tells how many cents of EBIT remain for each EUR invested.
This can also be related to sales: EBIT divided by invoiced sales = return on sales (ROS).
Example:
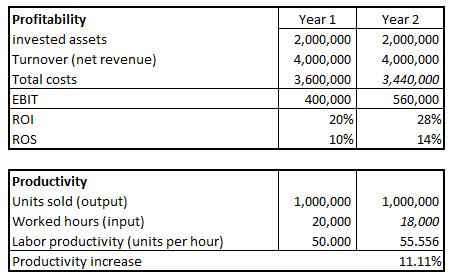
1 million ring binders are sold at EUR 4 (= 4 million sales) and total costs of EUR 3.6 million are incurred for this, resulting in an EBIT of EUR 0.4 million and thus a return on sales of 10%. If, by improving internal processes in year 2, the number of employee hours to be used, the material input or the costs for machinery and equipment worth EUR 0.16 million can be reduced, the return on sales increases from 10% to 14% and the ROI from 20% to 28%.

Profitability and productivity
Productivity
A productivity metric is a ratio between output and input quantities, e.g., number of units sold divided by the labor hours required to do so in the overall company (labor productivity). Because employee performance, machine input and money input can change the output / input ratio, all factors of the ratio must be made equal. The easiest way to do this is with monetary values.
The productivity increase in the example is 11.11% (for the 1 million ring binders, costs of 3.44 million EUR were incurred instead of the previous 3.6 million, i.e. 11.11% more productive output).
The profitability figures include all input factors (employees, raw materials, external services, equipment) with their prices, which means that price changes in the procurement markets have a direct impact on profitability. Productivity improvements on the other hand show that an output unit was furnished with fewer input means.
It is to be concluded that an organization must concentrate above all on productivity increases if it wants to survive in competition and be sufficiently profitable. In simple terms, it is necessary to look for opportunities to produce and sell more units with the same number of personnel and equipment.
Experience curve
The experience curve provides empirical evidence of the importance of productivity gains. Bruce Henderson (see literature) has analyzed the relationship between productivity and profitability with his empirical studies of input/output-ratios for a wide variety of products and markets. From this he derived the experience curve. It states that with every doubling of the cumulative output quantity, the value-added costs can be reduced by 20 – 30%. This is true for all types of organizations, including public administrations and NPO’s.
Example:
If an organization manages to process 1,200 orders with the same number of staff that is used today for 1,000 orders, productivity will increase accordingly. As a consequence return on sales and return on investment will also be higher.
Productivity increases are always to be sought everywhere. This is because it can be assumed that the competition will also try to reduce the resources used per unit of output in order to lower their value-added costs per unit and thus generate higher profitability.
Realizing the promises of the experience curve means to plan efficiency gains already in medium-term operational planning and to measure in the target to actual comparison whether these have actually been realized. If, for example, an annual efficiency target of 3% compared with the previous year is envisaged, ideas must be found on how to reduce allowed times and material consumption in production and how to reduce personnel deployment per product unit throughout the company. These efficiency objectives are to be stored in the bills of materials, work schedules and cost center plans. The improvements achieved can be measured in the management accounting system.
