
Last Updated on March 12, 2024 by Lukas Rieder
The experience curve adapted for the company itself forms the orientation framework for medium-term operational planning. Will it be possible to keep real costs within the empirically established “development corridor” of minus 20% to minus 30%?
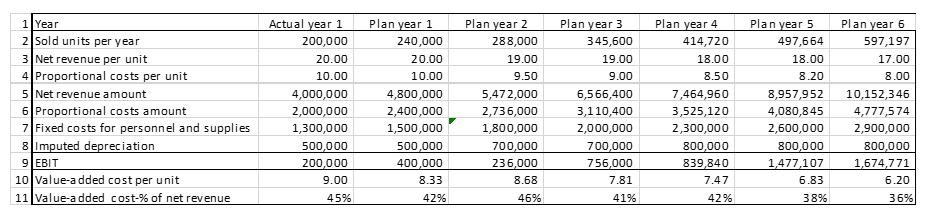
The development of the income statements for the medium-term planning horizon, which is already known from previous posts, represents in condensed form the current processing status of medium-term planning. Lines 10 and 11 show that average value-added costs per unit are falling in absolute and percentage terms, although net revenue per unit is also declining. The planners expect that the competition will also reduce prices in the planning period.
If the development planned to date is integrated into the company-related experience curve from the previous post, the following graphic results:
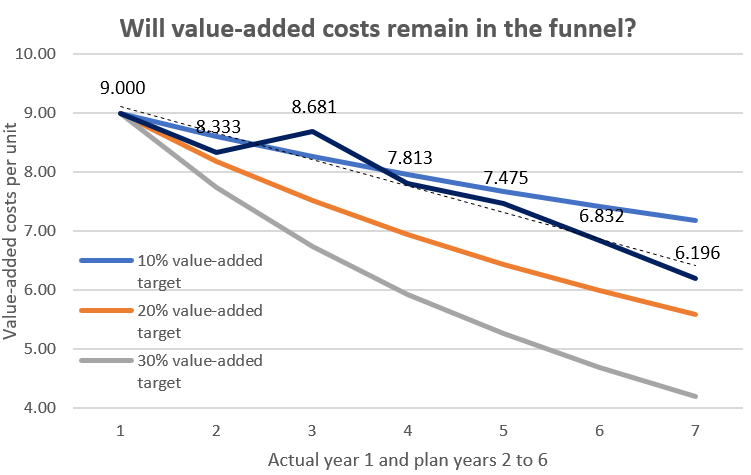
Experience curve and medium-term planning
It can be seen that the planned values to date are moving in the “funnel” but have not yet reached the 20% experience curve. The dotted trend line suggests an experience curve of about 15% for the planning horizon.
What is to be done?
Since it is not yet known in the planning phase whether the competition could grow faster through price reductions and thus achieve a better experience curve, the personnel and material costs as well as the imputed depreciation in the cost center plans must be revised again.
According to the budgeted income statements to date, personnel and non-personnel costs as well as imputed depreciation will rise sharply in plan year 2. In particular, fixed value-added costs will increase by 0.5 million. This explains the jump out of the “funnel” in plan year 2 and the resulting increase in the share of value-added costs from 42% to 46% of net revenues. In plan years 3 to 6, value added costs then rise again more slowly than net sales, which is reflected in the improvement in the company’s own experience curve and, of course, in higher EBITs.
Consequently, the plan revision must focus primarily on the plan values for personnel and material costs in the cost centers and look for ways to spread the useful live of the investments over more years, since they determine the amount of imputed depreciation.
The effort required to create your own experience curve is manageable. Comparing the curve with the company’s own medium-term plans makes it possible to see in which cost centers to look for cost-cutting opportunities first.
The comparison of the current planning status with one’s own experience curve quantifies the cost gap that must be closed in the coming years if the competitive cost position is to be maintained. The ability to compete is largely built up in the medium-term planning.