
Last Updated on March 12, 2024 by Lukas Rieder
Bruce Henderson (cf. B.D. Henderson, The Experience Curve, Boston Consulting Group, Perspectives nr. 16, 1968 ) has proven with extensive empirical studies (ex post) for entire industries or for the product volumes offered in a market in various industries that:
The real (inflation-adjusted) full value-added costs decrease by 20 to 30% with each doubling of cumulative output volume.
Promises of the experience curve
The practical application of this finding in one’s own organization requires that the statement be viewed in a differentiated manner:
-
- The cost reduction applies to every doubling of the cumulative output quantity (since the market launch of an offering). How quickly a doubling takes place consequently depends on the market and on the company’s own growth. In fast-growing markets, a doubling of the cumulative output quantity (of all suppliers) can take place in a few months; in mature markets, it may take several years.
- Value-added costs comprise the costs of the services provided within the company itself. These are primarily the total (proportional and fixed) personnel costs and the externally purchased services consumed, as well as depreciation and amortization (fixed costs only). They are incurred so that the company’s own services can be delivered and profit can be generated. Direct product-related material and external service costs are not part of the value-added costs, as these are determined by the suppliers. Value-added costs are calculated by deducting from total expenses in the income statement the material and external service consumption directly caused by the products sold.
The value-added costs per unit sold must be reduced if competitiveness is to be increased. The graph shows the development of the value-added costs for each doubling of cumulative output quantity, assuming that the items sold remain the same.
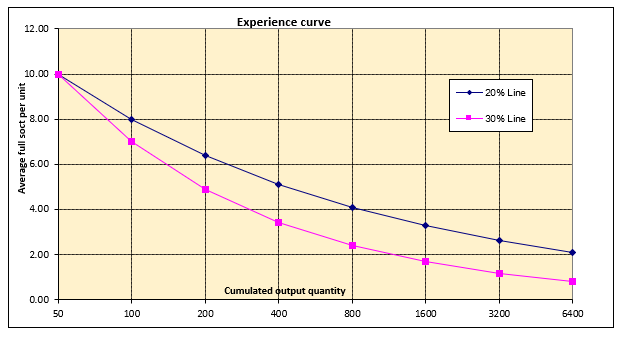
Value added and cost of goods sold per unit must be reduced based on experience.
-
- The absolute company profit increases as long as the sales price can be maintained (in the example at 12.00) and the value-added costs as well as the costs for material and external services can be reduced according to the doublings.
- However, the experience curve also applies to competitors. If they manage the doublings faster, they also have the chance to reduce their value-added costs per unit faster. This increases their potential to lower their net selling prices and thus improve their market position.
- The graph does not contain a calendar reference. Therefore, it is not yet possible to derive which cost reductions can be realized in which years. The corresponding procedure will be explained in a further post.
There are four factors that determine the realization of experience curve progress: economies of scale, learning effect, improved processes, and product design.
-
- Economies of scale occur more or less automatically. If the sales volume and thus the production volume increase, the fixed cost block is distributed over more units, which reduces the average complete product cost.
- People and machines learn from experience. Through repetition, consistent processes can be completed in less time. Processes become more efficient, resulting in lower processing times per unit. Administrative processes can also be completed with less time and fewer errors. Integrated data processing makes information available across departments, and machine learning and artificial intelligence can automate many evaluation tasks.
- By using new and more powerful equipment, manufacturing can be done with less time and possibly improved quality. Often, such investments are combined with capacity expansions.
- New materials and new designs enable more cost-effective manufacturing. Changes in product design should at the same time allow for higher sales volumes and changed sales prices.
Application example:
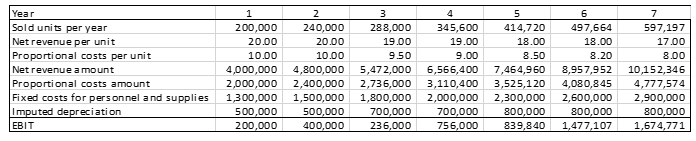
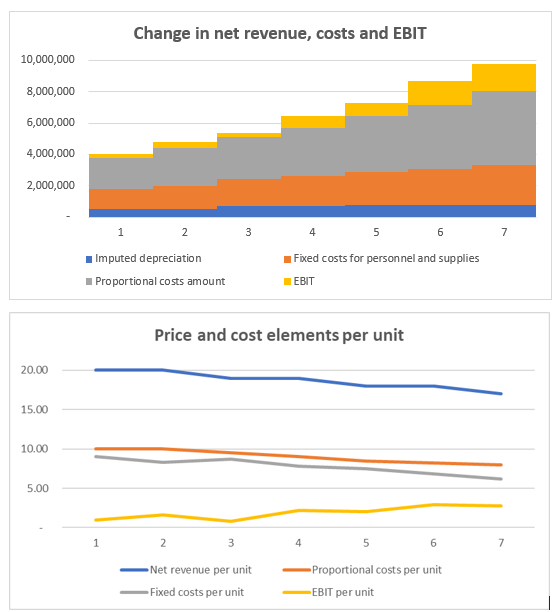
The table and the graphs show by way of example how the experience curve factors and the increase in sales volumes over seven years affect earnings before interest and taxes (EBIT):
-
- The increase in sales volumes over the years leads to sharply rising net revenues per unit, despite falling net revenues.
- Fixed costs fall per unit, although the absolute amounts for depreciation and fixed personnel and material costs rise (fixed cost degression).
- Due to learning effects and process improvements in production as well as possibly due to more favorable material purchases, the proportional manufacturing costs decrease from 10.00 to 8.00 per unit.
The form of presentation of the changes selected above presupposes that in management accounting a clear distinction is made between proportional and fixed costs and that a contribution margin calculation is prepared (cf., the corresponding posts on management accounting in this blog).
Note that only fixed cost degression is an automatic consequence of growing sales volumes. Realizing the promise of the experience curve in one’s own organization requires great effort in operational planning, implementation and control. Cost reduction opportunities must be sought everywhere in the company, not just in the products. Lower absolute personnel administration costs reduce the average costs per unit in the overall view just as much as a disproportionately low increase in IT costs in relation to sales growth over the same period.
In the next posts, methods and procedures will be shown which support the achievement of the improvements.