Last Updated on March 12, 2024 by Lukas Rieder
For the empirical proof of the experience curve, series of actual figures from various industries were used. These showed that the value-added costs per unit decreased by 20 – 30% for each doubling of the cumulative output quantity. This finding can also be used as a guideline for planning for one’s own company. Based on actual data (partly estimated), a company-specific experience curve can be drawn up. This can be used to analyze whether the medium-term planning figures will be suitable for implementing the experience curve in one’s own company.
Experience curve for Your company
The following initial data are required:
-
- Cumulative sales volume to date
- Value added costs of the most recent actual year
- Planned sales volumes for the planning horizon under consideration.
From this data, a “funnel”, i.e., a corridor for the development of the allowable value-added costs, can be calculated.
First, the annual context must be established (Compare with the table “calculation of cost reduction targets” below):
-
- In line 1, the actual sales volumes of year 1 and the planned sales volumes of the planning years 2-7 are entered.
- The sales volume of the assortment sold before year 1 is entered in line 2 (500,000 units). Since this is only a rough estimate, all product units are considered equal for simplicity. Also in line 2, the accumulated sales quantities until the end of the planning horizon are calculated.
- From this, the doublings per year can be calculated in line 3. The formula for this is:

Formula to calculate annual doublings The fact that these values are continuously decreasing expresses that despite sales volume increases, an increasing number of years is needed to achieve another doubling.
-
- Line 4 shows the cumulative doublings of the planned years in relation to the initial situation. They form the basis for calculating the theoretical experience curve values.
- In line 5, the value added costs per unit of the actual year are calculated (1’800’000 : 200’000 sales volume = 9.00).
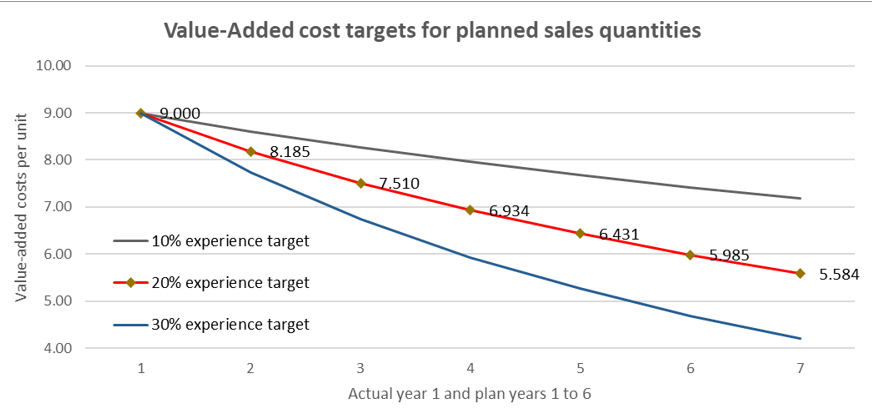
- Since a cumulative doubling of 0.4253 is to be achieved in planned sales in year 2 compared to actual year 1, the value-added costs of the previous year are exponentiated by the cumulative doubling factor (0.4253 in planned year 1). Depending on the selected experience curve target, this results in the value-added costs to be achieved in the respective plan year (e.g., 8.19 for the 20% experience curve for plan year 1, line 7).
- Purely arithmetically, the experience curves of 10%, 20% and 30% can be determined in lines 6-8 for the value-added costs per sales unit to be achieved.

Graphically, the “funnel” is created, in which the planned and effective value-added costs should move within the medium-term planning horizon shown (Plan1 to Plan 6).

The next post will ask whether the medium-term cost center plans for the value-added cost areas will be able to meet these requirements. If not, ideas must be generated on how to reduce the planned costs of the affected cost centers. If this requirement cannot be met, the company will lose competitiveness due to excessively high value-added costs.
Importance of cumulative past sales volume
It is often difficult for companies to determine the cumulative sales volume to date, either because the data is missing or because estimates had to be made due to changes in the portfolio.
If, in the model presented above, the cumulative past sales volume is entered as 0 units, the value-added costs to be achieved per unit sold in plan year 1 and assuming an experience curve target of 20% will decrease from 8.19 to 6.49 per unit. In the opposite case, where the cumulative sales volume to date is 1,000,000 instead of 500,000 units, the allowable value-added costs increase to 8.49 per unit.
If these extreme variants are considered, it can be seen that an incorrectly estimated or calculated cumulative sales volume is significant, but the target values to be achieved change little. Overestimated cumulative past sales volumes lead to lower cost reduction targets for the planning years, while underestimated ones lead to higher ones. As these are planning targets, possible misestimates are justifiable.
