Last Updated on March 12, 2024 by Lukas Rieder
Bottleneck Orientation
Various reasons can lead to the fact that products and services manufactured or refined in-house cannot be delivered according to customer requirements, i.e. in line with incoming orders.
The possible causes are manifold:
-
- Insufficient inventory of finished or semi-finished products
- Lack of raw materials or late deliveries from suppliers
- Energy or other operating material deficiencies
- Failure of machines or tools
- Insufficient personnel capacities in production cost centers
- Delayed final quality inspections of manufactured items
- Insufficient production capacities of certain facilities
In such situations, it is important to identify the respective bottlenecks and to master them in such a way that the available capacities are used optimally until the bottleneck is eliminated. This optimal utilization occurs when the maximum possible contribution margin I is generated, taking into account the dominant bottleneck in each case. Because, as has been shown several times in this blog, the contribution margins generated are used to cover fixed costs and profit.
Cost center planning
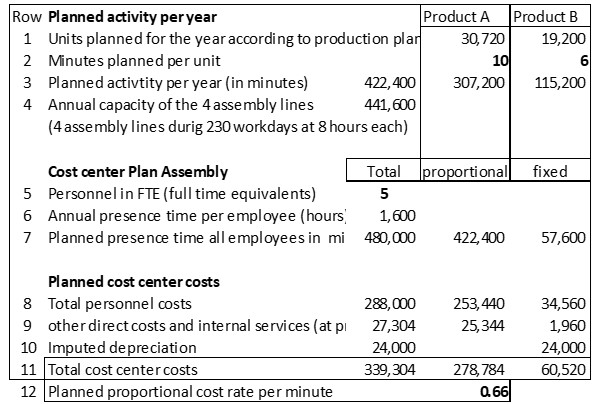
In the example company Ringbook Ltd. the sleeves and closing mechanisms are joined together to ring binders ready for sale in the assembly cost center. For this purpose 4 parallel assembly lines are available. Each of these lines is in operation for 8 hours per working day. With 230 annual working days, the capacity of each line is 230 * 8 * 60 minutes = 110,400 minutes. Together all four assembly lines have an annual capacity of 441,600 minutes.
Production management planned an annual activity of the assembly area of 422’400 minutes (see lines 1 – 3). The capacity of 441,600 minutes should therefore be sufficient for the planned production. For each piece of ring binder produced, an employee in the assembly department works 1 minute. 57,600 minutes are planned per year for organization, cleaning, maintenance and training (lines 6 and 7). In total, the presence time of the five employees (including cost center managers) amounts to 480,000 minutes. After taking into account the other direct costs, the costs directly caused by the products amount to 278,784 in line 11 in the “proportional” column and the proportional planned cost rate of 0.66 per minute in line 12.

Product costing and contribution margins
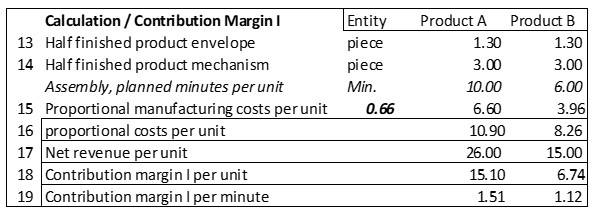
In lines 13 – 19, the product costing and contribution margin calculation can be traced. Product A requires 10 minutes per piece in the assembly line, product B 6 minutes. Together with the costs for the envelope and for the binder mechanism, the proportional costs per unit result in line 16. In line 18, the contribution margins per unit are calculated.

Machine breakdown in assembly
One of the four assembly lines suffers a machine breakdown. The supplier reports that four months !! will pass until the necessary spare parts will be delivered and the plant will be ready for operation again. As a result, one third of the capacity of one of the four lines is missing, namely 36,800 machine minutes (cf. line 4: 441,600 / 4 / 12 x 4). These are no longer available for assembly.
The production manager wants to reduce the production of product A because each unit of A requires 10 minutes of production time, whereas for product B it is only 6 minutes per unit (line 2). The sales manager replies in the management meeting that the contribution margins of the products must be considered before the production program is determined. Who is on the right track?
Line 19 gives the answer. Product A generates a CM I per piece of 15.10. Per minute of bottleneck usage (cost center assembly) this is 1.51. Product B uses the bottleneck less, but because of the lower sales price “only” generates a CM I of 1.12 per minute.

If the remaining capacity of 73,600 minutes (line 20) were used exclusively for product A, a CM I of 111,136 could be generated, while concentrating on product B would generate 82,677 (line 22). This is, of course, a hypothetical calculation, since what has to be produced is what the customers buy. However, the difference of 28,459 CM I between the two products shows that concentrating on the products that are stronger in terms of the bottleneck leads to a higher total CM I and thus to a better company result.
This example intends to show that in operational management it is necessary to analyze in each case how a bottleneck affects the overall result, e.g. earnings before interest and taxes (EBIT). For this purpose, the CM I per bottleneck unit must be calculated. Bottlenecks can be raw materials that are difficult to procure, insufficient service availability from suppliers, own personnel capacities or the availability of own equipment.
If the activity level decreases, but the personnel cannot be used in other cost centers or cannot be committed to a lower degree of employment, the fixed costs, resp. the spending variances of the considered cost center increase. To avoid this is the task of the cost center manager concerned.
