Last Updated on March 12, 2024 by Lukas Rieder
The dominating bottleneck
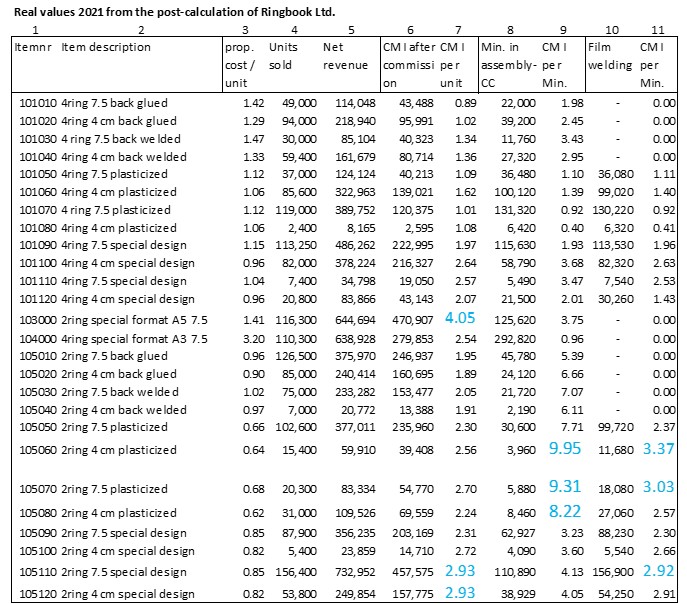
The table below shows how much contribution margin I per bottleneck unit is generated by the individual products of Ringbook Ltd. The data basis are the actual values of the year 2021 (sales volumes, realized net revenues, recalculated proportional manufacturing costs, actual employment in the assembly and foil welding cost centers). In each case, the best three items are marked in blue.
Column 7 shows that item 103000 achieves the largest contribution margin per unit (4.05). This is followed by articles 105110 and 105120. It is therefore worthwhile for the salespersons and for the company to concentrate primarily on these three products. 4.56 units of item 101010 must be sold to generate the same contribution margin for fixed cost coverage as one unit of 103000. The market potential of the standard item 101010 (first line) is naturally much greater than that of item 103000 (special A5 format with wide back). The sales staff of Ringbook Ltd. recognized this and therefore exploited the market potential of article 103000 better than the competition, with 116,300 units sold.

Final assembly of the ring binders takes place in cost center 250 (Assembly). Column 9 shows that the articles 105060, 105070, 105080 achieve the highest contribution margins per minute of assembly time. If assembly becomes a bottleneck due to machine failure or insufficient personnel, the articles mentioned are consequently to be produced first.
If the available output in the foil welding shop becomes a bottleneck, this only affects the foil-wrapped articles. Of these, articles 105060, 105070 and 105110 are to be produced first, as they achieve the highest CM I per minute of bottleneck utilization.
Since the material consumption for sheet steel and wire is more than twice as large for 4-ring binders as for 2-ring binders, in the event of a supply bottleneck for these raw materials, the achievable CM I per piece would have to be related to the individual material costs per piece (not shown here).
Prerequisites for bottleneck analyses are on the one hand, the existence of the bills of material and the routings of the products to be manufactured. On the other hand the split into proportional and fixed costs must be set up in cost center planning. This is because to make optimum use of the remaining capacity in a bottleneck, it must be known which articles generate how much CM I per dominant bottleneck unit. For this calculation, the split into proportional and fixed costs is necessary in the cost centers so that the proportional product- and manufacturing costs can be determined.
Throughput
Typically, order intake is the dominant bottleneck. Customer demand and the skills of the sales force determine net revenue and contribution margin. When internal bottlenecks occur, the aim is to keep throughput as high as possible until they are eliminated. This would argue for selling and manufacturing primarily those products that make the least use of the bottleneck. However, the numerical example above showed that from the overall perspective of the company, contribution margin I must be maximized in order to cover the fixed costs and the target profit.
Therefore, it is important to sell first those products or services that achieve the highest CM I per bottleneck unit.
Inventory levels are not relevant to the decision-making process in terms of throughput. This is because the dominant bottleneck area must be continuously supplied with the raw materials and semi-finished products needed to operate at full capacity at all times. When and how much of an article is to be purchased is determined by the replenishment lead times, the delivery capabilities of the suppliers and their price conditions. In addition, there are safety stocks so that the cost centers can continue to produce if delivery is delayed for other reasons. Many manufacturing companies therefore try to agree “just-in-time” delivery with suppliers. This way, they oblige the suppliers to stock enough units in their own company.
