
BCG-Matrix
Bruce Henderson and the Boston Consulting Group developed the BCG -matrix in 1970. It is intended to support strategic planning and management of companies with different products or business areas as well as different market areas. In the widely known four fields
-
- Question Marks (question marks ?)
- Stars (products with a high market share in growing markets)
- Cash Cows (Dairy cows)
- Poor Dogs (discontinued products)
all product or service areas of a company are entered so that the product/market portfolio can be recognized.
To determine the appropriate field in the portfolio, information on the previous course of the product life cycle (sales, cash flow, profit and growth rates) of the company’s own product or market areas is required, as well as the growth rates of the observed market. The company’s own relative market share can be estimated by comparing its own sales with total sales in the observed market.
The table below shows the absolute and relative sales shares of the market participants in a product area. The data in the “We” column comes from the company’s own invoicing, while that of the main competitors A and B and the other suppliers (remainder) comes from publicly available information or estimates.
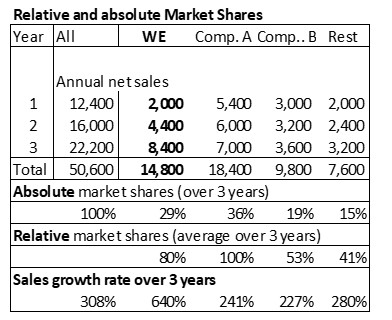
Compared to the largest provider A,”We” has a relative market share (average of 3 years) of 80% (14,800 / 18,400) and an absolute market share of 29% (14,800 / 50,600) compared to the total market.
Total market is growing strongly. In 3 years, sales increased from 12,400 to 50,600, i.e. by 308%. The company’s own growth rate is even higher at around 640%.
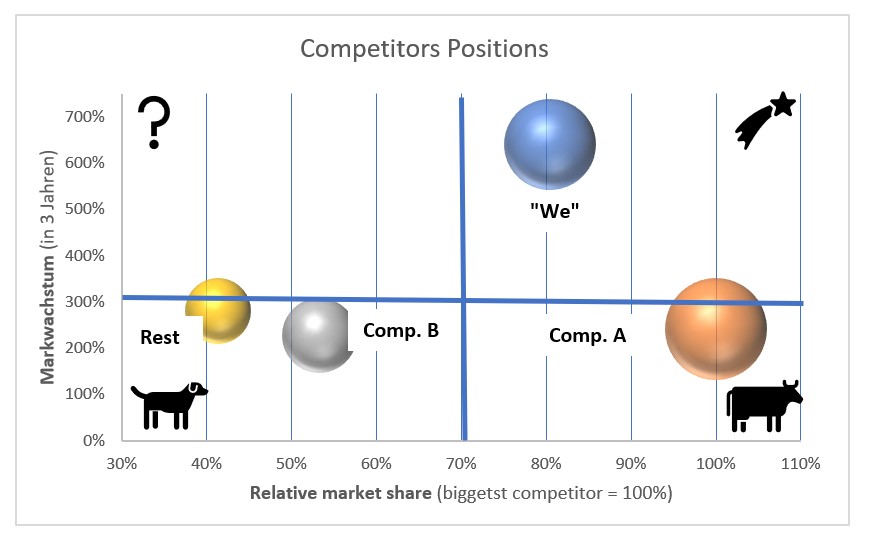
In the BCG matrix, the relative market shares are shown on the X-axis and the growth of the total market on the Y-axis. The size of the bubbles represents the sales volume of the individual providers. This allows to put the positions of the individual providers in relation to the sales leader and the competitors. For presentation the X- and Y-axes have been adjusted to the minimum and maximum values. Competitor A is (still) the sales leader. The sales of the other providers are positioned on the X-axis in relation to the market leader:
-
- Competitor A is given the cash cow position because its sales growth is lower (247%) than that of the overall market (308%), but it still has the largest market share.
- “WE” has caught up massively in terms of sales growth but is still in the “rising star” position. Sales are almost as high as those of competitor A. The reason for this is the strong sales growth of the last three years.
- Competitor B’s three-year sales growth is slower than that of the other market players. As a result, its market position is slipping into the “poor dog area”.
- The providers in the “Rest” group have grown slower than competitor A and “WE”. They do not seem to be able to provide potential customers with an offer that meets their needs. Their position has not improved in comparison to competitor A and “WE”. Because the “Rest” group is lagging behind in terms of sales development, it has slipped into the “Poor dogs” category.
As competitor A is already in the cash cow position, it must try to maintain sales for as long as possible, reduce or at least maintain the fixed costs of its own division and reduce proportional unit costs. This results in higher cash returns for the company, which can be used to build up new potential for success.
As long as “We” sales grow faster than those of the competitors, the business segment remains a rising star and should ensure that absolute contribution margins grow. These can be used to expand the company’s own market position or to finance new “question marks”.
“We” can use the cash released by this development to invest in question marks and to finance the growth of the stars.