Quantify the Draft Strategy
Bringing a strategic plan to decision-making maturity requires the cooperation of many people who are often already heavily burdened with the execution of their usual tasks. It is therefore advisable to make a rough estimate of the expected financial impact of the draft strategy. Only when this rough assessment is positive is it worth starting an implementation project.
A quantified estimate should be made for the following items:
-
- How much additional net revenue (quantity x expected net sales price) could the proposed strategy generate annually?
- What will be the expected unit-related material and external service costs per unit to be sold?
- How many manufacturing hours will approximately be required to produce the proposed products or services? The hours estimated are multiplied by the personnel cost rate of the respective activity cost center. The proportional personnel costs per unit result.
- With this information the expected contribution margin I per unit can be calculated.
- New product/market combinations usually lead to additional fixed (mainly personnel) costs in sales, production, purchasing and administration. These are also be taken into account.
- Finally, strategic plans often lead to investments in fixed assets (capacity expansions) as well as to external service expenses, which are necessary for the realization of the strategy and must therefore be covered by the proceeds of the strategy.

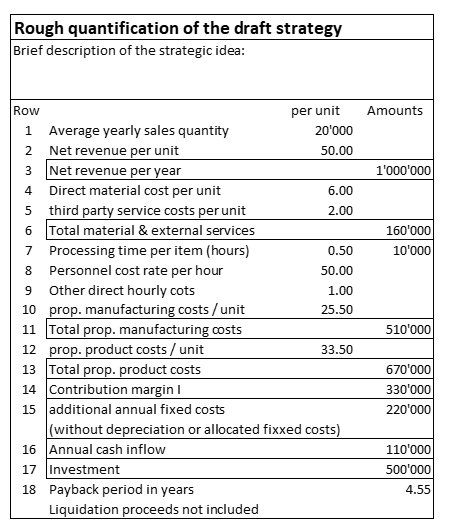
The net cash inflow from the market is estimated in lines 1 – 3. The sales quantity is to be assumed for an average product of the strategic idea. It also forms the basis for calculating the volume- and the hourly costs. Only the net amounts to be invoiced will lead to cash flow. For this reason, expected discounts and expected margins for intermediaries must be deducted.
Changes in inventory are not taken into account in this first estimate. For this reason, the material and external service costs per unit can be multiplied by the sales volume in lines 4-6.
The proportional production costs are estimated in lines 7 – 11. The assumed processing time per unit includes all cost centers directly involved in production. The personnel costs per hour as well as the other direct hourly costs are multiplied by the processing time. This results in the estimated proportional production costs per unit (line 10) and for the planned sales quantity (line 11).
The absolute contribution margin I to be expected from the project can then be calculated in line 14.
Insofar as the strategy will require an expansion of management capacities for production, procurement and sales, estimated additional fixed personnel and other costs must be entered in line 15.
If the intended strategy will lead to capital expenditures for new equipment (machinery, buildings, vehicle fleet, IT) and for externally commissioned feasibility studies, the corresponding estimated amounts should be entered in line 17.
This rough estimate of the average expected annual sales volumes, net revenue and proportional production costs per unit is sufficient to calculate the contribution to fixed cost coverage and profit generation (CM I = 330,000 per year). After deducting the additional annual fixed costs resulting from the strategy, the expected annual cash flow is calculated.
The payback period of this strategy design is calculated in row 18. In the example, it will take around 4.5 years for the investments to be paid for by the annual cash flows.
This rough quantification of the draft strategy is worthwhile, as only a few quantities, consumptions and values need to be estimated. With few figures it is possible to assess whether further development of the project is promising.
If the payback period is longer than 4 years, there is little chance of achieving a higher company profit with the project. This is because interest must be paid on the investments and the net cash flows will result in additional taxes on profits.
If the draft strategy clears the payback hurdle, an implementation project can be applied for.
