Welcome to Management Control

Weak Signals

Weak Signals

The media report daily on new developments in the various sub-environments of a company. News about new technological findings, newly offered products or services, shifts in market demand, new competitors, new technical and legal regulations and changing consumer behavior could have an impact on future business and jobs. The diversity of such news is overwhelming.

Managers are wondering how they can achieve the goals of their operational business and at the same time not miss any developments in their corporate environments that could affect their business model in the future.

Weak Signals
Weak Signals

The basic engine of data-, quantity and value flows” shows that the achievement of objectives can be achieved within the company system, but that information on the future positioning of the company can only be found in the company’s sub-environments. The right external orientation is essential for the company’s survival. However, no organization has the capacity to evaluate all external messages with a suspected connection to its own future. The idea of searching for weak signals in the corporate environments can help.

Weak signals are generally referred to as the “… earliest, smallest signals that indicate possible changes, but whose effects are not yet fully recognizable” (free translation from P. Gomez, M. Lambertz, Leading by Weak Signals, p. 9). A weak signal should be followed up if its content could become important for the implementation of one’s own strategies or for the continued existence of one’s own company.

Employees, managers and company owners hardly have time to cope with this flood of data, as they are already fully occupied with operational management. Therefore, it is important to consider:

    1. What makes a message a weak signal?
    2. How can weak signals be filtered for one’s own organization?
    3. Who is responsible for evaluating and processing the data and deciding what needs to be assessed internally (triage)?
    4. How are one’s own specialists and managers involved in assessing the weak signals in relation to the company?
    5. Who decides whether the insights gained require strategic and operational plans or even corporate policy principles to be adjusted?

Regarding 1 and 2: The signal should relate to the needs of the company’s own or prospective customers, to the company’s range of products or services, or even to the company’s basic ability to survive. Newly offered services or products could make the company’s own offering obsolete or at least compete with it. The know-how of the company’s own employees could no longer be sufficient to meet the changing demand. The possibilities of procuring raw materials and services for the manufacture of one’s own products and services could be restricted or the purchase prices could rise dramatically. Legal regulations or political developments could impede or prevent the sale of one’s own products. Finally, behavioral changes in in the social environment can also be weak signals, for example, when leisure time is given more weight than disposable income.

3 and 4: Those who are mainly involved in production, distribution and customer care have little time to worry about potential changes in the business environment. Personnel capacities must be built up to monitor environmental changes and classify their potential effects (in-house and/or external agents). They should explain the weak signals identified to the planners, preferably before the strategic planning is revised, so that they can incorporate them into their planning considerations.

Ad. 5: The assessment of weak signals leads to a need for action and thus to more working time and additional expenditure. The resources required for this (especially personnel and money) must be approved by the company management and the owners, since the downstream areas do not want to and cannot take responsibility for this.

To ensure the successful continued existence of a company, management must decide whether the strategic and operational plans are to be adjusted based on “weak signals” or whether the purpose of the company should be changed.

Sustainable success, early warning and weak signals

Companies with a future should be resilient. They must be able to cope with stress and crises as well as new challenges in order to develop in a healthy way. This is achieved when the company adapts its offerig to the future requirements of the market in good time, because markets and thus demand are constantly changing. The products and services that are successfully sold today lose their market position because other companies bring new, more promising offers to the market for potential customers. As a result, the company’s own sales and contribution margins fall, profits melt away and the staff that was previously relevant for success seeks better jobs.

Weak signals in the corporate environment should lead to the identification of impending changes before they occur. This is because the organization needs time to adapt to impending changes.

Weak signals, especially from technology, sales and procurement markets, as well as from the social environment, provide indications of which developments are to be monitored in the near future. To avoid the capture and analysis of weak signals getting out of hand and leading to paralysis through analysis, the search area must be narrowed down.

Since its foundation in 1911, IBM Corporation has continuously observed weak signals, developed new products and applications for them, and has revolutionized the way it approaches the market on numerous occasions. Details can be found in Wikipedia  .

At the beginning of the 1980s, the author of this article was still learning how to punch cards, to program the forerunners of spreadsheets and to sell the available systems. Since then, IBM has completely reinvented itself at least four times. Midrange computers, personal computers, printers and other peripherals are business areas that IBM sold years ago when they were still generating considerable profits. Today (2024), IBM is at the forefront of cloud computing, blockchain technology and data security, artificial intelligence and consulting. The share price was around $14 in 1994 and $170 at the end of 2023.

From a helicopter perspective, it appears that IBM has continuously moved from one product or market life cycle to the next. When the growth curve was still pointing upward but the growth rates began to decline, they began to conquer new markets with new technologies. In order to raise the cash needed to develop the new business areas, they sold off financially (still) successful parts of the company so that they could invest the liquidity in new business areas.

Empirical studies by McKinsey consultants Bradley, Hirt and Smit prove that the approach of lining up life cycles, as described, is an effective idea for achieving sustainable growth. Peter Gomez and Mark Lambertz show how the search for suitable weak signals for one’s own company can be focused by analyzing leading indicators.

The Present Value of a Strategy

The present value of a strategy

Dynamic investment appraisal is the most suitable tool for assessing the financial impact of the strategy implementation project. This is because it includes the entire time horizon of the strategy and takes into account not only the expected net revenue, costs and investments in the respective year of origin, but also the development of the balance sheet items.

From the contribution margin calculation in the post “Precalculation of a Strategy Implementation“, the unit-dependent CM I are transferred to the investment calculation for each year. They represent the expected annual cash inflows from the market (rows 1 – 8).

The expected cash outflows for additional fixed costs are deducted from this (rows 10 to 12) in accordance with the information in the post “Quantifying the implementation project”. This leaves the cash flow before interest and taxes (CFBIT, row 13) for each plan year. This cash flow is first used to pay for the net investments in the company’s balance sheet. The remainder belongs to earnings before interest and taxes (EBIT).

The present value of the strategy

Change in balance sheet items

A strategy has an impact on various balance sheet items:

    • Sales growth automatically leads to an increase in accounts receivable. If customers pay their invoices usually after 30 days, 1/12 of the turnover is not yet in the bank account and is not yet available for the payment of wages and purchases (calculation in row 14).
    • Sufficient inventory of finished standard bookends BE is always required to ensure timely delivery to customers. The company should always have the estimated bookend requirement for 30 days available in stock. If sales increase, the assets tied up in the finished goods warehouse must therefore also increase (rows 15 and 16). The front flap bookends BEF are only produced to order. They therefore have no stock.
    • The semi-finished and finished goods inventories are only valued at proportional production costs. This is because the cost center fixed costs are included in rows 10 + 11, see the post “Flexible Budget“.
    • To be able to produce on time, the necessary stocks of raw materials and semi-finished products also increase. These also tie up assets but are neglected in this example.
    • Similarly, increasing purchases lead to higher accounts payable. If suppliers are paid within 30 days, a purchase will also only debit the bank account 30 days later (row 17, but not filled in the example).
    • If a strategy requires investments in fixed assets, their payment reduces the bank account balance or increases the bank debt. The investments required for strategy realization were listed in the post “Quantify implementation project” and are shown in row 18 in the planned year of the investment.

All cash flows from operations (rows 1 – 13) and from investments and divestments (rows 14 – 20) are summarized in row 21. This shows the absolute cash inflows and outflows the strategy should generate during its lifetime. Cash outflows are expected in years 0 (start of strategy implementation), 6 and 7. In the other years, there should be positive cash inflows.

Is profitability in line with the market?

When private individuals or companies lend money to others, they usually expect to get this amount back and that they will also receive interest on the money lent. This automatically raises the question of which interest rate properly covers the risk of the loan.

Because quantifying the risks of money lending is a global concern, statistical analyses are carried out annually to determine the weighted average cost of capital (WACC) for various industries in many countries. We summarized these analyses with data from 2013 in the book 360° Management on  pages 243 ff. and evaluated them on a country- and industry-specific basis. For an “average company” in Germany, this resulted in a target ROCE (return on capital employed) of 10%, for Austria of 9.5% and for Switzerland a target ROCE of 6.5%. In 2023, the percentages were roughly the same. The difference between Germany/Austria and Switzerland is mainly due to the fact that the market risk premium and the current profit tax rate are significantly lower in Switzerland.

If a WACC of 10% is assumed for Bookends Ltd., this means that the expected cash flows from the strategy project must be discounted to the decision date (end of year 0):

Is profitability in line with the market?

Notes:

    • The present value-factor of the cash outflows in year 0 is 1.0 because the cash outflow happens at the beginning of the strategy implementation (present value factor = 1).
    • The cash outflow of 81,120 at the end of year 1 has a present value of 73,827 at the time of the decision for the strategy (present value factor = 0.909). This is because the money will not arrive until one year later after starting the strategy realization. If this present value is subtracted from the 150,000 initial investment, the present value balance of the strategy at the end of year 1 is -76,173.
    • The cash flows of the following years are also discounted at an interest rate of 10% and accumulated in row 23.
    • At the beginning of year 4, the cumulative present value balance is > 0 (line 22). This means that the previous investment amounts have been fully repaid as well as the interest of 10%.
    • The net revenues and the contribution margins decrease from year 5 onwards. The life curve of the front flap bookends is slowly coming to an end. Nevertheless, positive cash flows are still realized up to year 5. This is in line with the experience of many companies that the cash flows from the products in the cash cow and poor dog phase are used to earn the money to finance the question marks (see the post “Evaluating the product life cycle”).
    • In years 6 and 7, the cumulative cash value decreases again and develops negatively. As shows line 9 in the complete investment calculation, considerable CM I can still be generated. Consequently, in year 5 it will be necessary to consider how the fixed costs of the strategy (rows 10 and 11) can be reduced in good time, e.g. by employing the bookend staff in cost centers that will then have uncovered personnel requirements.
    • The Excel function “IRR” can be used to calculate the internal rate of return of the annual cash flows of the strategy (17.7%). This rate is important if several strategic ideas are competing for available investment funds.

Conclusion on strategy quantification:

It is advisable to quantify strategic projects already at the planning stage and therefore before the final decision is made. To this end, achievable additional net revenue, expected proportional production costs and changes in fixed costs should be taken into account.  Stepwise contribution margin planning in combination with the present value calculation provides these insights before the budgets are released.

Download the complete Excel model for investment calculation here and adapt it to your own requirements.

Precalculation of a Strategy Implementation

Precalculation of a Strategy Implementation

A product/market strategy should help to increase company value. The calculations in the post “Quantifying the draft strategy” are not sufficient for the strategic decision because

    • the estimated quantities and the net revenues per sales area and product for the intended strategy period are still missing,
    • information on proportional material and external service costs for the new products or services to be offered is missing (bill of materials of the items to be assessed),
    • for the new products or services it has not yet been determined  in which cost centers which unit-related processing steps are to be carried out (work plan per new service or new product),
    • it is not clear yet for the new products which additional fixed costs will be required for the sales, production and support areas (cost center plans),
    • the necessary investments in buildings, equipment, vehicle fleet or rights and licenses are not yet taken into account.

This data is preferably created in the ERP-system and in the management accounting system because the data structures and historical values are already available there:

    • If customers, products, sales quantities, prices and sales deductions as well as bills of materials and routings are stored in the ERP-system, the new products can also be created in these data structures.
    • In management accounting the cost center plans with their personnel and machine capacities, the proportional cost rates and the fixed cost blocks are available. This allows to calculate the proportional production costs of the new products or services.
    • The deciding managers must be able to build on this database because they will be responsible for the success of the strategy.

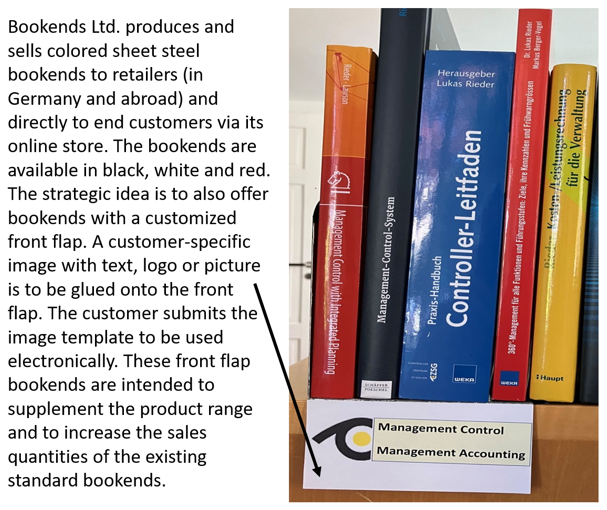
The procedural steps for quantifying the implementation project of a strategy are developed in the example below. It must be shown whether the production and sale of individualized bookends for private or public libraries can increase the value of the company.

Front Flap Bookend
Front Flap Bookend

Intended manufacturing process

The starting material for the standard bookends are 1 mm thick and 12 cm wide steel coils. Sheet metal plates with a length of 24 cm are punched from the coils and are bent into a 12 cm wide and 12 cm high bookend.  The bookends are then painted black, white or red and individually wrapped in a transparent protective film.

For the intended front flap bookend 18 cm wide steel coils are required because the front flap should be 6 cm high and 12 cm wide. Punching a front flap bookend will result in sheet metal waste of 6 x 12 cm per piece. The coil supplier can recycle this waste.

The area to be painted increases by 12 x 6 cm per unit compared to the standard version, i.e. by 25%. The front flap bookend can be punched, coated and packaged on the existing machines.

The front flap is customized using an image template of the customer’s choice submitted electronically. The “image processing” cost center is to be set up for this purpose. It should take on the following tasks:

    • Checking the images submitted by e-mail for the front flap and sending the order to the external printer of the self-adhesive images
    • Gluing the returned foils onto the bookends front flap.

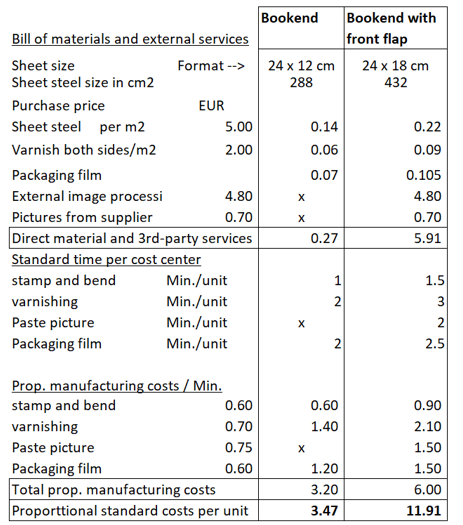
It is advisable to create the bill of materials and the work plan for the intended front flap bookend in the ERP system, as almost all the materials to be used and the processing cost centers are already available in the system. Based on this data the planned proportional costs of the existing and of the new front flap bookend can be calculated:

Precalculation of a strategy implementation

With this calculation the strategy deciders recognize which costs are directly caused by the production of the bookends. The planned proportional costs per unit are a key prerequisite for assessing whether the introduction of the new product will lead to higher company profits.

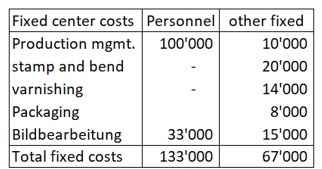
The annual fixed costs of the production and image processing cost centers were estimated (excluding depreciation and interest) and recorded as a planning basis in management accounting:

Fixed costs of bookend production

These fixed costs are also relevant to the strategy assessment.

Net revenue planning

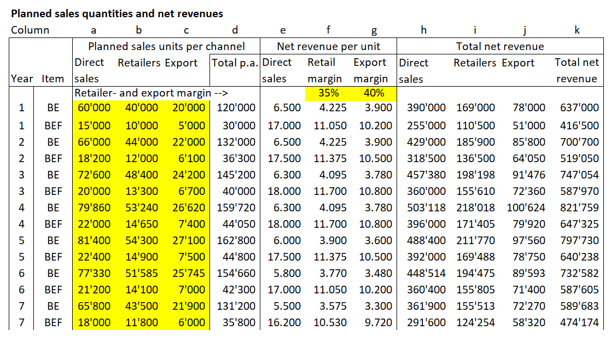
Together with product management, the sales organization considered how many units per product could be sold annually in the sales channels (direct sales, sales via dealers in Germany and exports). In doing so, they did not focus on the manufacturing costs, but tried to estimate the sales prices that potential customers would be willing to pay for the individualized front flap bookend by means of competitor comparisons.

They also estimated how the life cycle of the products might develop. The experience curve shows that both the sales quantities and the net revenue per unit decrease towards the end of the life cycle due to market saturation and the market entry of imitators.

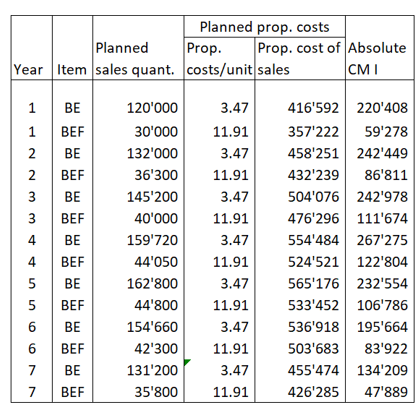
The expected quantities per sales channel (columns a-c, yellow boxes) and the expected net revenue (columns e-g) were estimated for an expected product life of 7 years and entered in the table. It had to be taken into account that domestic and export dealers will require a margin share of gross sales to cover their own efforts (columns f and g). The expected net revenue of Bookend Ltd. is shown on the right-hand side of the table (rows h-k), BE = Bookend, BEF = Bookend with front flap.

Planned sales quantities and net revenues

Planned development of absolute contribution margins

The proportional production costs of the two types of bookends were deducted from the planned net revenue (column k above). To simplify matters, it was assumed that the proportional product costs per unit will not change over the strategy horizon. This resulted in the absolute contribution margins I per item to be expected annually.

BE and BEF Contribution margins

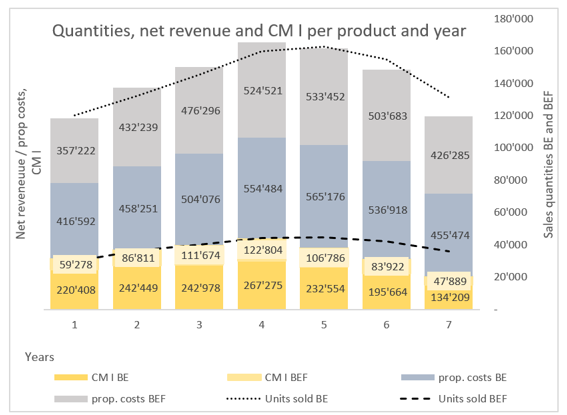
In the following graph the expected annual absolute contribution margins I from bookends BE and front flap bookends BEF are highlighted in yellow. These must cover the additional fixed costs, the investments and the target profit of the strategy.

BE and BEF annual contribution margins

These annual contribution margins must cover the additional fixed costs and investments listed below:

    • Additional fixed personnel costs of EUR 100,000 are expected annually and beginning in year 3 in bookend production because more production orders will have to be processed and more operational personnel will have to be supervised.

Increasing production volumes will require investments in production facilities:

    • Year 0 (before the start of production of front flap bookends): Adaptation of the punching and bending system, approx. EUR 90,000.
    • Year 0: Installation of the system for positioning and gluing the front flap images, approx. EUR 60,000.
    • Year 2: Addition of a heating tunnel to the paint shop for approx. EUR 80,000. The heating tunnel reduces the drying time and thus increases the capacity of the paint shop by 40%. The processing times per unit will remain the same as before.

As these cash outflows for additional fixed costs and investments are expected in different years, the time value of money must be considered when deciding on a strategy. This is done in the next post with the help of the dynamic investment calculation.

Is it worthwile to do this detailed planning?

Definitely! If the described clarification of the strategic project were to cost EUR 100,000 in personnel costs (3-6 months of work) but would lead to a rejection recommendation, this amount would be much smaller than the outflow of funds that would result from an unsuccessful strategy implementation.


Quantify the Draft Strategy

Quantify the Draft Strategy

Bringing a strategic plan to decision-making maturity requires the cooperation of many people who are often already heavily burdened with the execution of their usual tasks.  It is therefore advisable to make a rough estimate of the expected financial impact of the draft strategy. Only when this rough assessment is positive is it worth starting an implementation project.

A quantified estimate should be made for the following items:

    • How much additional net revenue (quantity x expected net sales price) could the proposed strategy generate annually?
    • What will be the expected unit-related material and external service costs per unit to be sold?
    • How many manufacturing hours will approximately be required to produce the proposed products or services? The hours estimated are multiplied by the personnel cost rate of the respective activity cost center. The proportional personnel costs per unit result.
    • With this information the expected contribution margin I per unit can be calculated.
    • New product/market combinations usually lead to additional fixed (mainly personnel) costs in sales, production, purchasing and administration. These are also be taken into account.
    • Finally, strategic plans often lead to investments in fixed assets (capacity expansions) as well as to external service expenses, which are necessary for the realization of the strategy and must therefore be covered by the proceeds of the strategy.
Quantifiy the Draft Strategy

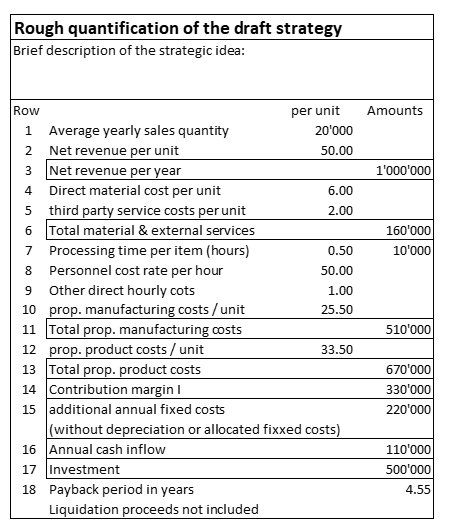
The net cash inflow from the market is estimated in lines 1 – 3. The sales quantity is to be assumed for an average product of the strategic idea. It also forms the basis for calculating the volume- and the  hourly costs. Only the net amounts to be invoiced will lead to cash flow. For this reason, expected discounts and expected margins for intermediaries must be deducted.

Changes in inventory are not taken into account in this first estimate. For this reason, the material and external service costs per unit can be multiplied by the sales volume in lines 4-6.

The proportional production costs are estimated in lines 7 – 11. The assumed processing time per unit  includes all cost centers directly involved in production. The personnel costs per hour as well as the other direct hourly costs are multiplied by the processing time. This results in the estimated proportional production costs per unit (line 10) and for the planned sales quantity (line 11).

The absolute contribution margin I to be expected from the project can then be calculated in line 14.

Insofar as the strategy will require an expansion of management capacities for production, procurement and sales, estimated additional fixed personnel and other costs must be entered in line 15.

If the intended strategy will lead to capital expenditures for new equipment (machinery, buildings, vehicle fleet, IT) and for externally commissioned feasibility studies, the corresponding estimated amounts should be entered in line 17.

This rough estimate of the average expected annual sales volumes, net revenue and proportional production costs per unit is sufficient to calculate the contribution to fixed cost coverage and profit generation (CM I = 330,000 per year). After deducting the additional annual fixed costs resulting from the strategy, the expected annual cash flow is calculated.

The payback period of this strategy design is calculated in row 18. In the example, it will take around 4.5 years for the investments to be paid for by the annual cash flows.

This rough quantification of the draft strategy is worthwhile, as only a few quantities, consumptions and values need to be estimated. With few figures it is possible to assess whether further development of the project is promising.

If the payback period is longer than 4 years, there is little chance of achieving a higher company profit with the project. This is because interest must be paid on the investments and the net cash flows will result in additional taxes on profits.

If the draft strategy clears the payback hurdle, an implementation project can be applied for.

Strategy Development

Strategy Development

In corporate management the term strategy is used for many different things. As a result, different approaches are recommended for developing a strategy.

Here the aim is to structure and execute the process of strategy development in such a way that plans for the medium-term development of a product/market combination are created and that the implementation results achieved can be assessed qualitatively and quantitatively. This is based on the definitions in the post “Strategy and Functional Concepts“. In particular, the definition of a unique selling proposition (USP) according to Michael Porter is quoted there.

Most of our clients want to increase their market share with a strategy in order to achieve higher earnings before interest and taxes (EBIT).

This searching and fixing process cannot proceed in a straight line from the identification of objectives to the assessment of results because the results to be achieved are not yet fixed at the beginning. External and internal information must first be obtained, often only insufficient data is available and various internal participants in the process with different levels of knowledge and intentions have a say. This requires a multi-phase approach to processing questions and many feedback loops. Additionally, the composition of the processing team often changes during the discovery process.

In the process of developing and adapting strategies, the following questions usually need to be answered:

    1. Which product/market combination do we want to strengthen? (Strategic idea)
    2. How do we stand out from the competition (USP, from the customer’s point of view)?
    3. Who are our competitors, what turnover/market share do they achieve?
    4. Which services/products do we not have to achieve our goals?
    5. What internal developments are the prerequisites for success, or what knowledge and skills need to be acquired?
    6. How much investment will be required?
    7. Which employees do we lack
    8. What critical premises are contained in the above points that could prevent a successful strategy realization in the target markets? Examples: New legal regulations, political shifts, changes in consumer behavior, successes of competitors.

Points 1 – 3 are externally oriented, i.e. changes in the corporate environment must be observed and assessed. They can lead to the adjustment of strategic goals and plans

The status of points 4 – 7 must be determined within the company. The necessary developments must be derived from this.

If events occur during the implementation process that affect the critical premises (point 8), it must be analyzed whether the current strategic plan (points 1 – 3) needs to be adjusted or whether adjustments need to be made to points 4 – 7.

This requires regularly feedback throughout the process of strategy development and after the interim results have been established. They must lead to a decision as to whether the strategy implementation should be continued (go) or discontinued (no go).

From the strategy draft to the implementation project

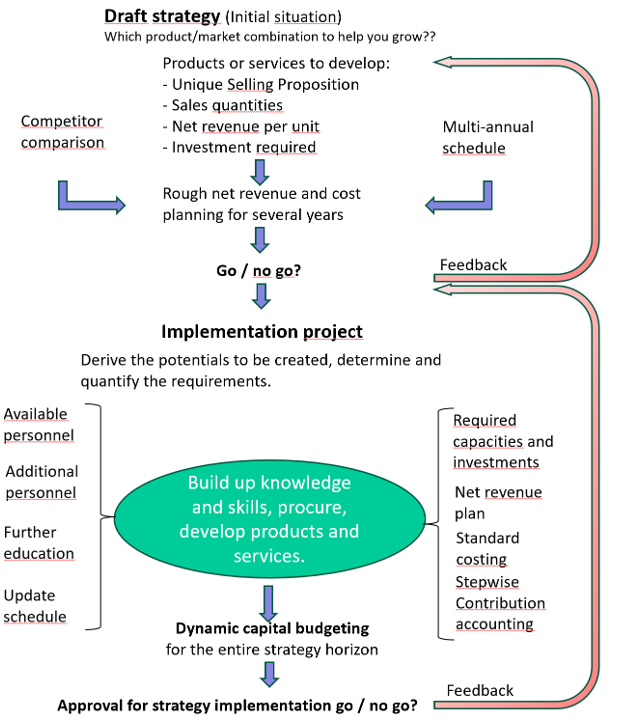
The flow chart below shows the path from the strategy draft (creative act) to the release of a strategic plan.

It starts with an idea of which products the company should use to gain market share in which (sub)markets in order to improve its own market position and profitability. The time horizon is usually several years and the behavior of the competition can prevent success. It is important to estimate the financial impact of the strategic idea as reliably as possible before investing time and money in the further development of the idea.

Strategy Development

To tackle a promising strategy implementation project, it is advisable to estimate the achievable net revenue and follow-up costs of the strategic idea for the envisaged strategy horizon. These assumptions should be included in the strategy draft because they form the basis for the first go/no go-decision, namely whether the strategic project should be approved for development at all. It only makes sense to continue the project work if it is a “go”. The description of the unique selling proposition is also essential for this. This is because the decision-makers want to be able to recognize whether the strategy can create a USP before they place the order for the actual implementation project.

SWOT-Analysis

SWOT-Analysis

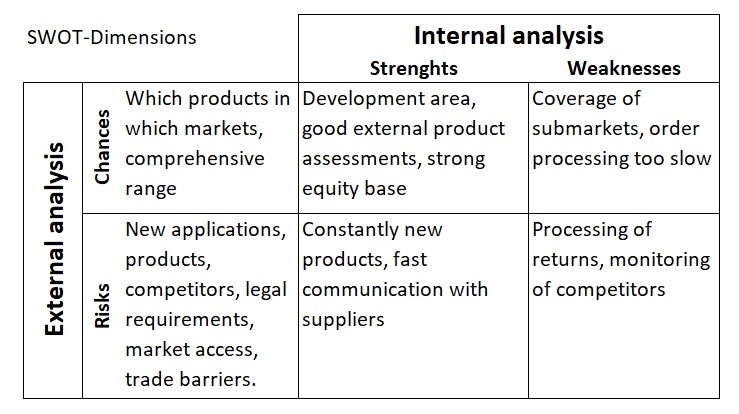
A SWOT-Analysis is intended to produce a structured presentation of the strengths and weaknesses of the organization under consideration and to compare these with the opportunities and risks in the four environmental spheres (see the post “Environmental Changes are Crucial“).

The purpose of the opportunities/risks and strengths/weaknesses assessment is to

    • create the basis for strategic planning and
    • define the potentials for success required for its realization.

The SWOT-analysis is primarily prepared by the top managers of an organization. They determine the direction in which the company/organization should develop and assess whether the targeted development will be feasible in the medium-term time horizon. The decisions derived from the SWOT-analysis form the template for the strategic and operational planning managers.

The subordinate management levels should derive with which services and products the company will achieve strong positions in which markets and which results should be achieved (corporate policy definitions).

The assessment and documentation of external opportunities and threats and the evaluation of the company’s own strengths and weaknesses form the input for strategic and medium-term planning.

Analysis of the environment and the company’s own position

The widely known SWOT-matrix shows the initial questions for the analysis:

Company environment: in which environmental areas opportunities for new products and services are presumed and which threats could prevent success?

Assumptions for the own development: In which product/market combinations does the company see its strengths for expanding its market position, and which of its own weaknesses could hinder success?

SWOT-Analysis
SWOT-Analysis

The above questions on opportunities and risks are examples. This also applies to the assessment of the strengths and weaknesses of your own company.

If a company’s management prepares its own SWOT-analysis and records its findings in the matrix, the subsequent management levels can align their strategic plans and, above all, the development of future potentials for success accordingly.

How strategic and medium-term plans are derived from the SWOT-analysis for the company as a whole is the subject of the following posts:

BCG-Matrix and the Life Cycle

BCG-matrix and the life cycle

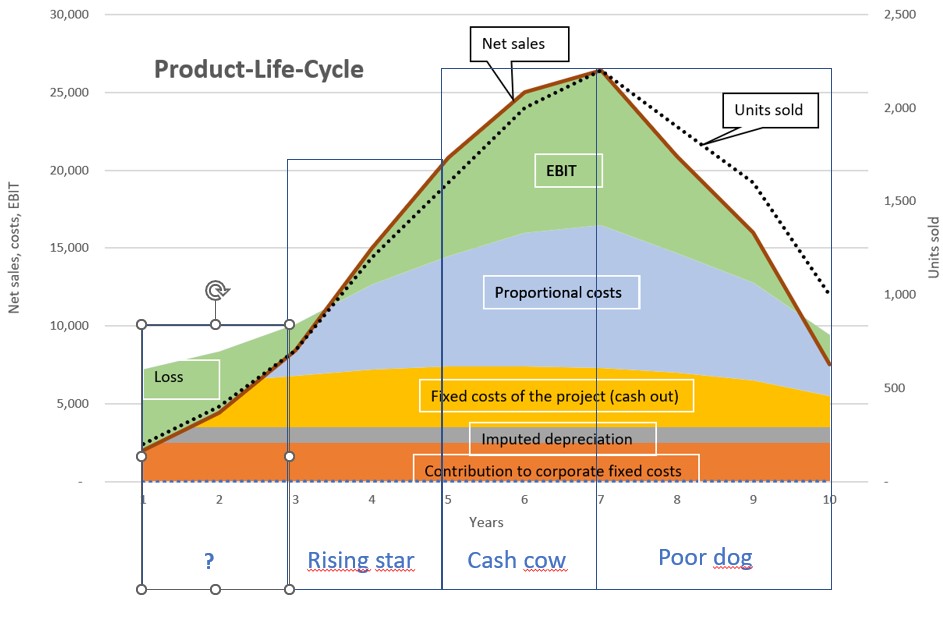
The four phases of a product or market according to the BCG-matrix can usually also be recognized in the life cycle of a product:

    • If a company achieves initial sales and turnover success with a new product or a new product group, it is not yet clear whether it will become a success. It is still a question mark.
    • If sales volumes and turnover increase more strongly than in the previous year (the curve is always steeper), this is a rising star. It is possible that not all costs are covered at the beginning of this phase, but the contribution margins are growing faster than the fixed costs. The product enters the profit phase.
    • The cash cow phase begins when the annual sales growth rates decrease compared to the previous year. Profits reach the highest absolute values, which also increases liquidity. Owners can be paid higher dividends or new question marks and stars can be financed.
    • The start of the downturn phase (poor dog) cannot be precisely defined. If the competition also records lower sales volumes, the downturn is probably already underway. In such a situation, it is important to know whether contribution margins are still being generated to cover the fixed costs of the product or sales area. If the contribution margins are tending towards zero, the product must be removed from the range as it no longer contributes financially to the company’s success.
    • BCG-Matrix in the life cycle
      BCG-Matrix in the life cycle

Effects on financial solvency

The BCG matrix also provides an important insight into a company’s liquidity:

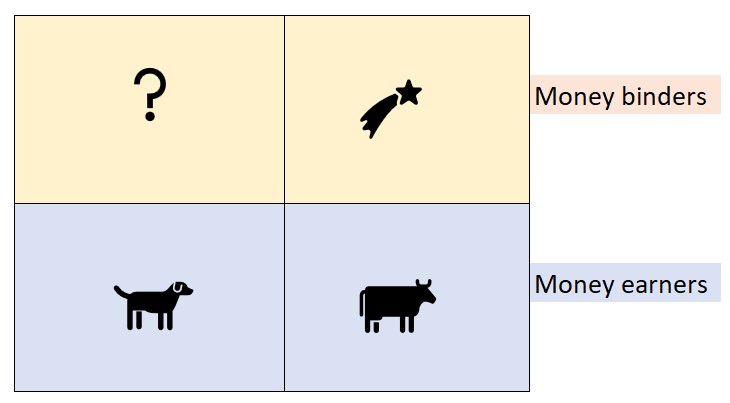
Question marks and stars tie up liquidity (available cash) because

    • more sales lead to higher accounts receivable,
    • higher inventories are required for timely delivery,
    • investments in fixed assets have to be paid for.

Cash cows and poor dogs free up liquidity because

    • there are hardly any new investments to be paid for in the business area,
    • due to falling sales, accounts receivable balances also become less,
    • less inventory needs to be financed in order to fulfill orders on time.
BCG-Matrix
BCG-Matrix (Money binders and money makers)

The combined use of the BCG-matrix and of the dynamic investment calculation is particularly recommended for strategic and medium-term operational planning. The focus is on the profitability of the targeted product/market positions. However, it is also to clarify whether the projects can be financed from the company’s own funds or whether external liquid funds will have to be procured.

BCG-Matrix

BCG-Matrix

Bruce Henderson and the Boston Consulting Group developed the BCG -matrix in 1970. It is intended to support strategic planning and management of companies with different products or business areas as well as different market areas. In the widely known four fields

    • Question Marks (question marks ?)
    • Stars (products with a high market share in growing markets)
    • Cash Cows (Dairy cows)
    • Poor Dogs (discontinued products)

all product or service areas of a company are entered so that the product/market portfolio can be recognized.

To determine the appropriate field in the portfolio, information on the previous course of the product life cycle (sales, cash flow, profit and growth rates) of the company’s own product or market areas is required, as well as the growth rates of the observed market. The company’s own relative market share can be estimated by comparing its own sales with total sales in the observed market.

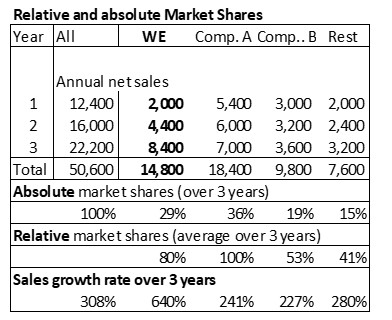
The table below shows the absolute and relative sales shares of the market participants in a product area. The data in the “We” column comes from the company’s own invoicing, while that of the main competitors A and B and the other suppliers (remainder) comes from publicly available information or estimates.

BCG-Matrix2
BCG-Matrix2

Compared to the largest provider A,”We” has a relative market share (average of 3 years) of 80% (14,800 / 18,400) and an absolute market share of 29% (14,800 / 50,600) compared to the total market.

Total market is growing strongly. In 3 years, sales increased from 12,400 to 50,600, i.e. by 308%. The company’s own growth rate is even higher at around 640%.

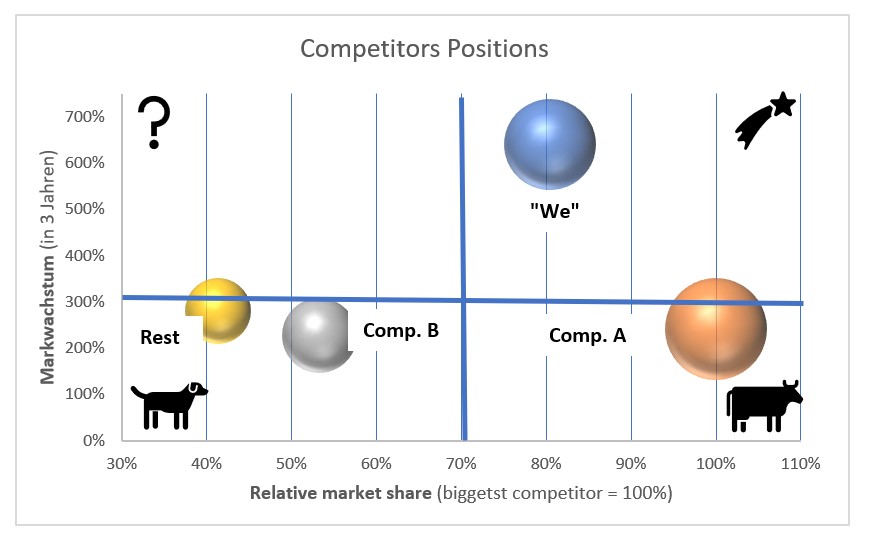
In the BCG matrix, the relative market shares are shown on the X-axis and the growth of the total market on the Y-axis. The size of the bubbles represents the sales volume of the individual providers. This allows to put the positions of the individual providers in relation to the sales leader and the competitors. For presentation the X- and Y-axes have been adjusted to the minimum and maximum values. Competitor A is (still) the sales leader. The sales of the other providers are positioned on the X-axis in relation to the market leader:

    • Competitor A is given the cash cow position because its sales growth is lower (247%) than that of the overall market (308%), but it still has the largest market share.
    • “WE” has caught up massively in terms of sales growth but is still in the “rising star” position. Sales are almost as high as those of competitor A. The reason for this is the strong sales growth of the last three years.
    • Competitor B’s three-year sales growth is slower than that of the other market players. As a result, its market position is slipping into the “poor dog area”.
    • The providers in the “Rest” group have grown slower than competitor A and “WE”. They do not seem to be able to provide potential customers with an offer that meets their needs. Their position has not improved in comparison to competitor A and “WE”. Because the “Rest” group is lagging behind in terms of sales development, it has slipped into the “Poor dogs” category.
Competitors Positions

As competitor A is already in the cash cow position, it must try to maintain sales for as long as possible, reduce or at least maintain the fixed costs of its own division and reduce proportional unit costs. This results in higher cash returns for the company, which can be used to build up new potential for success.

As long as “We” sales grow faster than those of the competitors, the business segment remains a rising star and should ensure that absolute contribution margins grow. These can be used to expand the company’s own market position or to finance new “question marks”.

“We” can use the cash released by this development to invest in question marks and to finance the growth of the stars.

Evaluating the Product Life Cycle

Evaluating the Product Life Cycle

In an industrial company, the following development of sales, costs and net revenue has been observed over the course of a product life cycle:

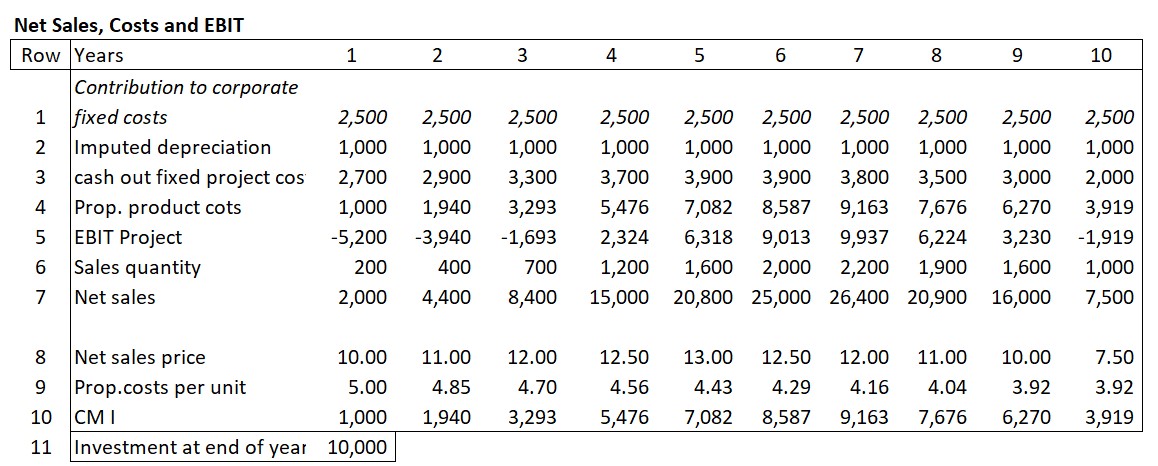
    • Line 6 of the table contains the annual units sold. The net sales prices achieved can be found in line 8. The annual net sales achieved (after deduction of all sales deductions) were calculated in line 7. The proportional costs of the units sold can be found in line 4. The recalculations of the various years showed that process improvements led to a reduction in the proportional costs per unit of around 3% per year compared to the previous year.
    • The annual fixed project costs (cost centers) leading directly to cash outflows were summarized in line 3. The investment of 10,000 for the necessary new equipment (line 11) was amortized evenly over the 10 years of operation (1,000 p.a., line 2). The management of the company requested that the product contributes annually 2,500 to cover fixed company costs and EBIT (line 1).
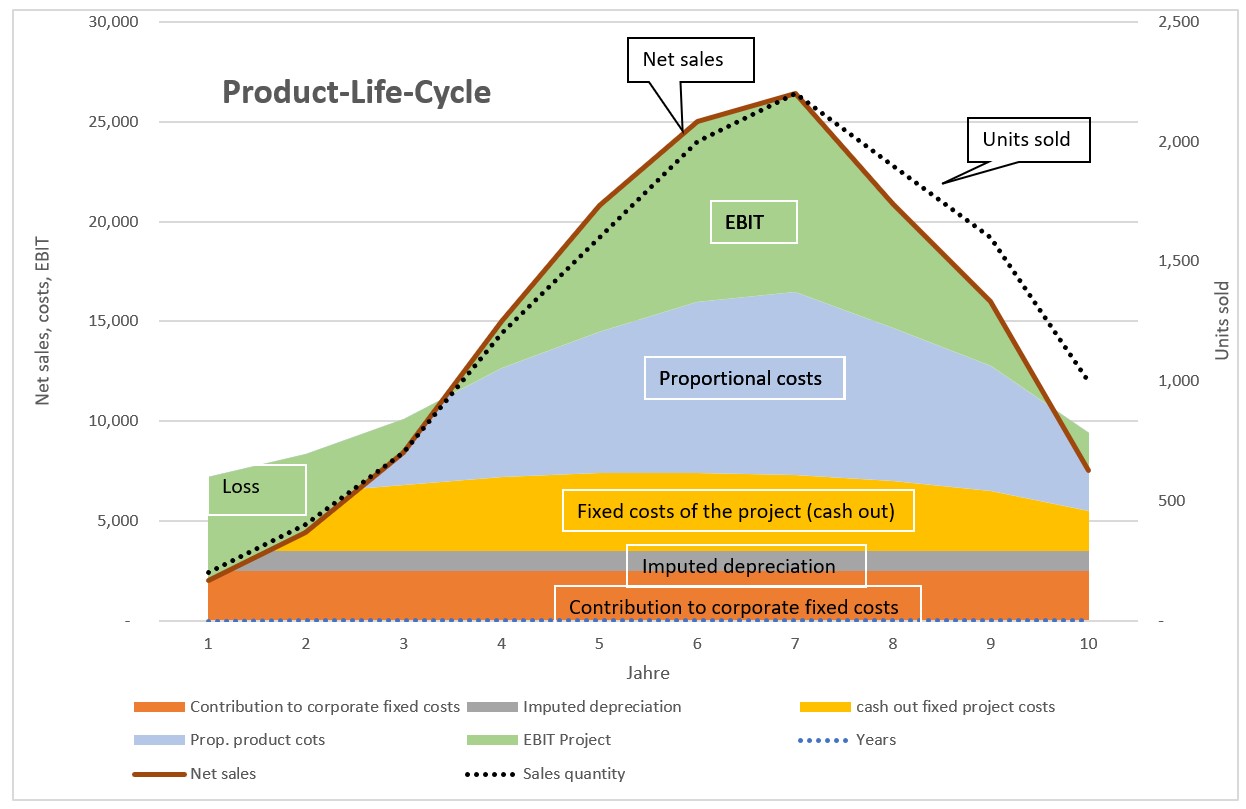
    • With this information line 5 shows the annual EBIT of the product. The order of lines 1 – 5 is chosen so that the fixed costs are at the bottom of the following chart and the net revenue is at the top.

Net Sales, Costs and EBIT

The chart visualizes the development over the years. This product generated losses in years 1 to 3 and 10.  However, the profits in years 4 to 9 were higher than the aforementioned losses. From year 7 onwards sales quantities and realized net sales prices fell sharply. Despite lower sales prices in years 7 to 9, profits were still generated (see line 5), as care was also taken to reduce project-related fixed costs.

Evaluating the Producct Life Cycle

If this analysis is also prepared as a cash flow statement for the various years, it can be seen that the cumulative present value of the product life cycle only becomes positive towards the end of year 7 (line 4). The cash flows from sales at the end of the life cycle increased the present value of the strategy. This increase occurred despite lower net sales prices because the investments had already been paid for and as well the annual fixed and proportional costs were reduced.

Due to the decline in sales beginning in year 8 accounts receivable and inventories also decreased, which led to high cash flows in years 8-9 despite the slump in sales (line 2).

Cash flows in the life cycle

Dynamic capital budgeting-calculation was used to determine the net present value of the life cycle.  This is particularly helpful to quantify strategic and medium-term operational plans (see the post “Dynamic Capital Budgeting“).

Rapid Offering for Contract Manufacturing

Rapid Offering for Contract Manufacturing

Different task owners of a company have to work together if an offer is to be prepared for a product (or service) manufactured exactly according to customer specifications:

    • Sales (direct customer advisor)
    • development, possibly research (feasibility)
    • Challenging production (cost) points (personnel and machine capacities), available capacity reserves
    • Purchasing (procurement of critical materials, transportation costs to the customer)
    • Controller (standard costing of the product or service, contribution margin targets)

The challenge for the company making the offer is, on the one hand, to have all internal data available for the potential business and, on the other hand, to be able to respond to the customer inquiry on time.

This requires being able to plan the potential order and also check the availability of personnel and machine capacities. It is also necessary to determine whether the raw material can be procured on time and whether any required semi-finished products will be available in inventory.

Plan and calculate the order in PPS before submitting the offer

For a customer-specific quotation, it is advisable to first enter the production order as a test in the PPS and to create a precalculation in management accounting. This is to clarify in advance whether the personnel and machine capacities will be available and whether the offer will generate sufficient contribution margin. PPS and precalculation are a central prerequisite for to quickly respond to customer inquiries. It must be possible to immediately retrieve or process all key influencing factors from the existing information system:

    • Customer data (address, contact person, order quantities, desired delivery dates, possibly qualitative specifications)
    • Market data (competing suppliers and their strengths)
    • Clarify technical manufacturability (development, possibly R&D)
    • Article data (search for and adapt articles with similar bill of material)
    • Work plan (processing steps and times per cost center/production center, setup, scrap rate, special tools if necessary)
    • Availability of raw materials and semi-finished products (availability, replenishment time)
    • Delivery times from suppliers
    • Planned capacity utilization of production facilities, next free availabilities (can also refer to development), especially important if short and long production orders run on the same production facilities
    • Proportional planned costs per unit for the requested product
    • Contribution margin targets for the product or potential order
    • Execution locks due to unpaid invoices (accounts receivable)
    • New tools to be manufactured for the order, their delivery date and costs.

As this is an offer for a service not yet provided in this form or a customer-specific product, the data mentioned is required to create a preliminary cost estimate and determine the possible delivery date. A large part of the data and processing structures are already stored in the ERP. Access to the current ERP data is also important because other orders are implemented during the processing time of the offern and the free production capacities change as a result.

Quick Response Teams

In order to win the customer or the order, the offer must be submitted quickly. After all, the customer is waiting for the proposal so that he can also supply his own customers on time and as required.

To shorten the lead time when preparing an offer, it is suggested that “quick response teams” be set up (Daniel Moser, Wertfabrik). The team members should report directly to the team leader and have complete read and evaluation access to the above-mentioned databases. They work cross-functionally and, if the ERP-system and the management accounting-system are up to date, they can avoid or at least speed up coordination, calculate the offer and determine schedule availabilities. If quick response teams are to be formed in companies that receive inquiries from different customer groups or application areas, it may be advisable to set up several QR-teams.

As the capacity for core products is often used by several areas, the QR-teams’ read-only access to the company’s entire capacity requirements planning is particularly important.

Reducing lead times also has an impact on the financial result:

    • Less money is invested in the warehouses and, above all, in the average “work in progress” inventory. This reduces interest costs and the need for equity. As few orders in progress as possible should have to wait for the next processing step.
    • Faster invoicing also leads to less need for credit and therefore lower interest costs.

The most important factor, however, is that the customer receives an offer sooner without false promises.