Simulation models

Simulation models

In simulations the chances of a decision are compared to its possible risks, quantified and evaluated. Users of simulation models are primarily the decision-making executives. Since decisions can only be made for the future, assumptions are first made regarding quantities, times and values to be achieved.

In order to increase the reliability of decision-making, as much reliable knowledge as possible should be incorporated into the simulations, i.e. previously realized quantities and net sales prices as well as actual costs. This can be sales volumes and net sales revenues realized with previous customers as well as the proportional and fixed costs incurred for these. A management accounting system provides this data if it meets the requirements described in the post “10 principles for Decision Relevance“.

    • If new customers are to be won with the existing services and products, it must be estimated what additional contribution margins are to be won with these new customers and whether new investments or higher fixed costs are to be expected for this growth. The additional contribution margins to be generated must at least cover the delta of fixed costs plus the delta of imputed depreciation from the investments.
    • If new products are to be added to the range, it must be estimated how much additional contribution margin can be generated by this expansion and whether this will be able to cover the additional fixed costs (including change in imputed depreciation) that have also been estimated.
    • If investments in information technology are to reduce the costs of planning and handling internal processes and documentation, it is necessary on one hand to estimate which cost center costs leading to cash outflows can be reduced and to what extent, and on the other hand which investments will be required for this and during how many years these investments can be used.

Is a campaign to win new customers worthwhile?

The sales management of Ringbook Ltd. is considering a campaign to acquire additional customers. From November to January, then when the filing cabinets for the following year are labeled in the companies, potential new customers are to be contacted. Article 105010, the standard ring binder for filing, is to be offered in this canpaign at the gross special price of 2.90 instead of 3.60 (approximately 20% discount). In the advertising brochure  however the offers for customized ring-binders are to stand in the foreground. At Ringbook Ltd. these products generate higher contribution margins per unit than the standard products.

It is planned to produce and stock an additional 20’000 units of ring-binder 105010 after the summer break. For the advertising campaign (letters and emails), a budget of 14’000 EUR is planned for brochures (design and printing) as well as envelopes and postage. 5’000 potential customers are to be contacted. The internal sales department will pack and mail the brochures. Should this advertising campaign be carried out?

Structure of the simulation model

The simulation model should be able to show how changes in the key values could affect the financial success of the promotion. Key values are:

    • How many potential new customers should be contacted, what proportion of them will order how many pieces of article 105010?
    • How many items sold at the special promotion price are needed to cover the costs of the promotion?
    • Are the personnel and machine capacities available to produce the planned quantities on time? Will this require working hours with shift allowances?
    • Can the existing internal sales staff perform the work for the promotion or are higher than planned personnel costs necessary for this?

Relevant for the decision are the assumptions made by the managers and existing data from the planning and control system of Ringbook Ltd. (see Management Control System, integrated planning and control and the simulation model contained therein).

The red fields are the preliminary assumptions of the managers, the blue fields contain the initial data from the simulation model of Ringbook Ltd.

Simulation models
Simulation models


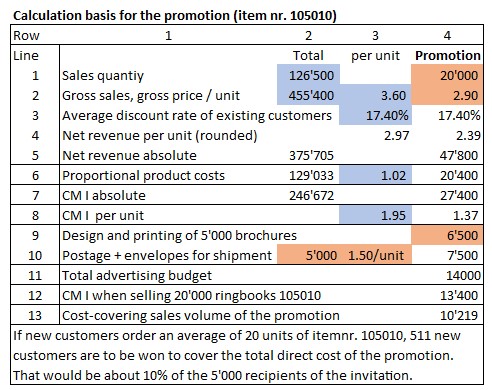
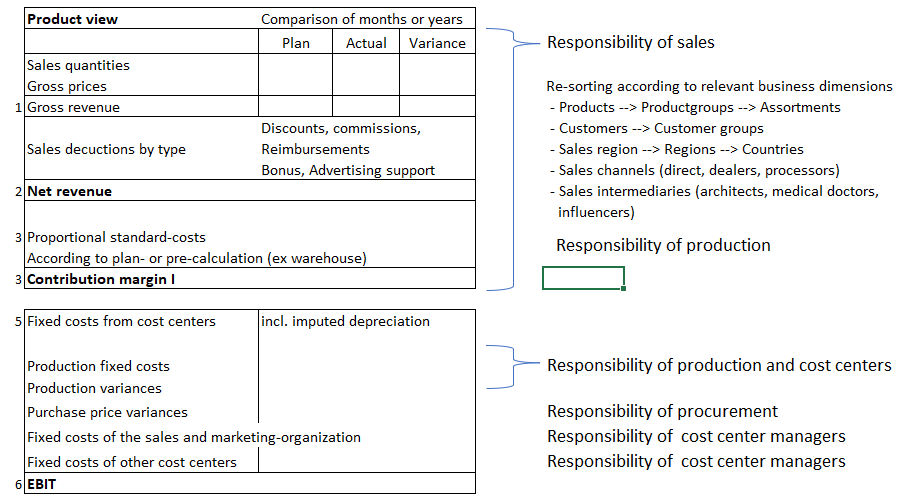
Columns 1 – 3 contain the calculation basis:

    • Gross sales divided by sales volume gives the applicable gross sales price of 3.60
    • The 17.4% is the average discount rate granted to existing customers based on their customer group membership. This gives the net revenue of 375’705 in line 5, column 2.
    • The proportional product cost per unit 105010 of 1.02 also comes from the simulation model.
    • With this information, the CM I per unit and per period (246’672) is calculated.

In column 4, the key values of the planned action are linked to the initial data:

    • Planned quantity, 20,000 pieces, gross sales price 2.90.
    • The average discount rate of 17.4% is taken from the annual planning, as well as the proportional manufacturing costs of 1.02 per piece.
    • If the planned 20’000 units can actually be sold as a result of the promotion, a CM I of 27’400 results. After deduction of the direct costs of the promotion (fixed) in lines 9 and 10, a profit improvement of 13’400 remains.
    • Due to the special discount, the CM I per unit decreases from 1.95 to 1.37. This means that the promotion is profitable if more than 10’219 units are sold at the promotional price (breakeven quantity of the promotion).

In the mentioned simulation model, the available and used capacities are also planned in minutes per cost center. From this evaluation, it can be seen that sufficient free capacity is expected to produce the 20’000 pieces for the promotion in the fall months:

capacity requirements

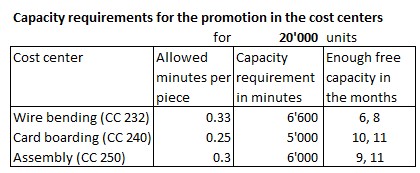
Capacity requirements

The described action to attract new customers can be carried out. It is worthwhile if slightly more than 50% of the items 105010 produced for the promotion can be sold at the special price. The unsold pieces are still in stock at the end of January at proportional product costs. The chance of persuading new customers to order individually equipped ring binders is intact. Approximately 4 months after the end of the campaign, it should be assessed which new customers have been won and whether they have bought again.

Data basis for simulation models in management accounting

The quantification of planned promotions should show how the results (contribution margins, fixed costs, investments) are likely to change. The prerequisites for this must be created in the operational systems:

    • In the resource planning system (ERP), it must be possible to plan material and working time consumption as well as capacities, sales and net revenues and to track them in actual terms.
    • The management accounting system must be structured as a step-by-step and multidimensional contribution margin accounting system so that the proportional planned product costs and thus the contribution margins to be achieved can be calculated.
    • The new investments to be expected must be taken into account. The previous depreciation costs are not relevant for the decision (sunk costs).


Prerequisites for Agile Team Management

Everything is becoming agile – really?

Prerequisites for Agile Team Management

“Agility is the ability of a company to adapt its business model and organization to new market demands and emerging opportunities in a short period of time. In other words, being agile means being reactive, flexible and adaptable on the one hand, while being proactive and anticipatory on the other (Andreas Diehl).”

“Agile methods include methods such as Scrum, Kanban or Design Thinking. As project management methods, they serve to optimize existing processes in teams and companies. Source: Ebook from Haufe Akademie, Management Challenges 2022, p. 44/45)”. The same article states, “… it depends on a culture of trust that encourages employees to actively and quickly develop individual solutions at the direct point of contact with customers, instead of waiting for central guidelines or being paralyzed by too many and too rigid bureaucratic planning, checking and reporting activities.”

According to change consultants Dr. Kraus and Partner, “…agile leadership refers to a style of management that is intended to enable fast and flexible action and reaction to changing conditions as well as market and customer requirements. In this context, the inclusion of employees in decision-making processes as well as a far-reaching delegation of competencies and decision-making powers to employees or teams are seen as central success factors.”

If agile leadership is contrasted with the design elements of the management control system, it is necessary to ask which planning and control methods and systems are required in the whole company so that the teams can develop customer-centric (external and internal) solutions independently, fast and successfully without jeopardizing or even thwarting the overall success of the company.

Prerequisites for Agile Team Management

If senior managers do not properly perform the tasks listed in the lower section of the figure, the foundations for the deployment of agile teams are missing. This is because appropriately trained employees are not available, buildings, machines, means of transportation and, above all, suitable hardware and software are lacking, and often also the money to pay for personnel, raw material and fixed assets.

Defined potentials for success and medium-term plans create the basis for agile management.

The success capabilities to be developed or expanded are to be derived from the corporate policy and the strategies. In the multi-year plan, the results to be achieved must be defined in a verifiable form and the necessary resources must be approved. Only this creates the prerequisites for reacting agilely to (mostly) urgent customer needs and still being able to realize the medium-term development goals.

Advance and feedback loops between operational planning and operational control are therefore an essential prerequisite if agility is to be possible (see also the post “main questions of each planning stage“).

Employer Attractiveness

Whether employees come and stay is mainly due to leadership behavior and incentivizing work content.

Employer Attractiveness

Employer attractiveness is understood as an organization’s power to attract applicants for positions to be filled and to retain key employees. As a result, a distinction must be made between external and internal employer attractiveness. The factors that make a company appear interesting to potential employees generate external employer attractiveness. Factors that promote the loyalty of existing employees are elements of internal employer attractiveness.

Employer attractiveness

External Employer Attractiveness

In an online survey in early 2022 by Randstad Employer Brand Research of 3,727 employees and job seekers aged 18 – 65 in Germany, respondents were asked about the five most important factors to them. The results, with comparable results from 2016 and 2101, are indicated below.

5 most important factors to choose an employer
The 5 most important factors to choose an employer

The change over time shows that while there are minor shifts in rank, partly caused by the COVID pandemic, the top 5 attractiveness factors remain the same.

Other surveys show the same five attractiveness factors as most important. For example, the opinion research institute Innofact AG conducted in May 2019 an online survey of 1,006 employees as well as apprentices and students representative for the German population. The survey produced the following ranking:Employer factors students and apprentices
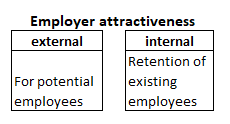
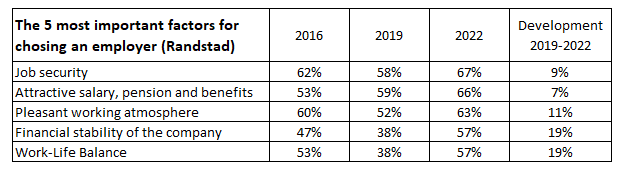
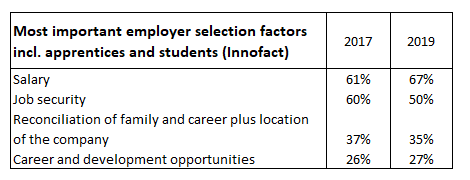
Employer factors for students and apprentices

Attractive employers for career starters

In 2015  https://berufsstart.de  investigated which characteristics companies should have to be perceived as an attractive employer by students, including graduates as well as young professionals.

In that study, in addition to the so-called hard, primary factors, the soft characteristics – the secondary features for the popularity of employers were determined for the first time. It was found that among the hard factors, opportunities for further training (88%) and opportunities for promotion (79.5%) enjoy the highest priority when choosing a suitable employer. For three quarters of all participants, the image of a company is the third most important factor. International orientation and job security are also given high priority.

Social benefits and infrastructure are rated by career starters as rather insignificant for employer attractiveness. Among the desired secondary features, the working atmosphere was considered with 91.2% the most important “soft” factor for the attractiveness of companies. Working atmosphere is always an essential basis for employee satisfaction and collegial cooperation. Varied activities (76.7%) as well as work-life balance and responsibility were almost equally important. For one-third of the career starters, family friendliness was a key reason for preferring a company. Less important for the choice of company were “flat hierarchies, benefits and leisure activities”.

Source (22.05.2022): https://zvoove.com/blog/was-bewerber-bei-unternehmen-schaetzen-die-attraktivsten-arbeitgeber-2015-studie-berufsstart-de

Main factors for employee recruitment

From the rankings and assessment priorities shown, a catalog of the ten most important aspects of external employer attractiveness can be derived. Without claiming to be exhaustive, the catalog is structured here according to the dimensions of AMPLE:

Working conditions

      1. Leadership behavior and processes
      2. Promotion and career opportunities
      3. Acceptable workload / flexible working hours
      4. Work-life balance, family and career
      5. Attractive location (commuting, buildings)

Profitability and Liquidity

6. Competitive compensation and benefits

7. Profitability and financial stability of the company

Evolution

8. Challenging employment, further training opportunities

Market position

9. Good products and services of the company

10. Good reputation of the employer

It is thus understandable that job offers (print or electronic media) should include information on these 10 attractiveness factors. Interested parties should be encouraged to ask more in-depth questions about these factors during interviews. The relevant documentation will probably mostly be prepared by the HR-department, but the points mentioned should also be addressed in the direct discussions between applicants and future superiors.

Internal Employer Attractiveness

It pays to do more for your own attractiveness as an employer!

The Institute for Leadership and Human Resource Management (IFPM) at the University of St. Gallen / Switzerland conducted extensive surveys and studies on internal employer attractiveness in 2015 and 2021 (this Top Job Trend Study can be downloaded at Trendstudie Arbeitgeberattraktivität (topjob.de). In 2021, 13,400 employees from about 100 companies of various industries and sizes were surveyed, 61% of whom were male. 20% of respondents were managers. 92% of the respondents were born between 1950 and 1996 (Baby Boomer, X and Y generations).

Qualitative comparisons between companies with high and low measured employer attractiveness were obtained by interviewing the executives. It was found that the group of companies with high employer attractiveness scored around a quarter better in terms of sales growth and employee innovation ideas generated. The proportion of employees’ productive working time was around 20% higher and the ROI achieved was also around 20% higher compared with the companies with low employer attractiveness.

Factors of internal employer attractiveness

When examining factors to increase internal attractiveness, it should first be noted that all employees perceive their reality subjectively and that emotional and action-related factors often have an unconscious effect.

Therefore, it is difficult to define universally valid catalogs of attractiveness-enhancing actions. However, many positively impacting behaviors can be derived from the literature and especially from comments made in interviews about the choice of the most attractive employers. From the presented empirical analyses above we derive the ten most important internal attractiveness factors (see also https://qualitrain.net):

    1. Management style and feedback culture of superiors
    2. Measurably formulated objectives to be achieved and explanation of their significance
    3. Degrees of freedom in implementation
    4. Measurement/assessment of achieved results (target-performance comparison) including verbal and written recognition
    5. Learning opportunities at the workplace
    6. Further training offers, also with regard to soft skills for interpersonal interaction
    7. Career opportunities within the company
    8. Work at home
    9. Reconciliation of work and family care
    10. Joint activities (where people meet and exchange ideas).

These factors are – according to the cited IFPM-survey – not really time-dependent. In our opinion, they represent the needs of employees that need to be met so that they feel comfortable in the company and want to engage themselves to achieve the company’s goals.

This requires that all managers, from top management to cost center or team leaders

    • regularly explain the corporate goals and the strategic objectives for each business unit,
    • agree on the annual objectives so that they know which results are important,
    • discuss the achievement of objectives at least twice a year and, if necessary, agree on corrective measures,
    • acknowledge and thank employees for the results achieved in the past months and the efforts made to achieve them,
    • take up the suggestions for improvement from the meetings and assess their feasibility or initiate their implementation, and
    • take up and process the comments of the interviewed persons concerning internal cooperation.

The main factors of internal employer attractiveness are thus mainly realized through the performance of people-related management tasks.

The financial compensation for work performed is still the most important and most easily comparable decision-making factor in all employee generations (from the baby boomers, birth years 1950-1964, to Generation Z, birth years 1996-2010) (see above).

Contribution Margin Accounting supports BSC

It is only in the overall view and in comparison with the plan that the extent to which the BSC proposals have been successfully implemented becomes apparent. To be able to put the overall picture together, quantities, services, times, inventories must be made equal. This can be done in the profitability analysis and in the internal balance sheet.

Contribution Margin Accounting supports BSC

If the profitability analysis is structured as a step-by-step and multidimensional contribution margin accounting, intermediate results can be presented for which the responsible managers can take direct responsibility. In addition, developments over time (from comparisons with the previous month to changes over several years) as well as planned to actual comparisons can be presented. Variances from the plan are shown to the accountable manager. There is no need to allocate variances to product units.

Contribution Margin Accounting as an Integration Tool

Find an example of stepwise contribution accounting here

Responsibilities and variance analysis

Salespeople can be responsible for net revenue first because they plan and control all the determining variables. If the planned proportional standard production costs are deducted from the realized net revenue of a sale, all variances arising in the downstream functional areas are left out. This allows the selling persons to also take responsibility for the CM I achieved in their area.

In line with the company’s own business model and market development, Contribution Accounting must be structured on a multi-dimensional basis:

    • In the product group view, the fixed costs of sales promotion can clearly be assigned to the contribution margins of the product groups or assortments. Product group managers can thus take responsibility for the CM I of their product group as well as for their own fixed costs that can be directly influenced. They are thus responsible for the contribution margin of their product group after deduction of their direct fixed costs and their spending variances.
    • Analogously, the contribution of a sales territory can also be planned and measured. The CM I achieved in a sales territory (after deduction of the proportional standard manufacturing costs) minus the directly controllable costs of the sales territory (cost center) result in the sales territory contribution.
    • If the sales channel is stored in the customer master data for each customer (e.g. direct sales, online, dealer), the contribution margin can also be calculated for this dimension. In this case, the fixed costs of channel support that can be influenced must be deducted from the CM I of the sales channel.

With the outlined multi-level and multi-dimensional CM-calculation, it is possible to clearly assign the achieved CM I as well as the fixed costs and the variances. Those responsible for sales can assess in each case how BSC activities did affect the results of their area.

Variances between the flexible budget and actual costs can occur in all cost centers. The difference between target and actual costs is called spending variance. The respective cost center manager is responsible for them (for the distinction between planned to actual and target to actual see “Flexible budget” in the glossary). The spending variances cannot be allocated to the product units according to their cause. In the stepwise contribution accounting-system they are presented at the lowest summarization level to which there is a clear reference.

Since production needs to adapt to customer demand and at the same time to take into account inventory targets in the warehouse, various types of variances arise for which the production manager is responsible, as he, together with his staff, is to achieve the planned values in the processed production orders. If the lot sizes in production increase due to larger sales quantities, this leads to positive lot size variances, because the setup costs only occur once per production order. If less material is consumed per piece than planned, positive material quantity variances occur. If more good pieces can be produced from the material input than planned, positive yield variances occur. If production orders are processed in cost centers other than those planned (due to bottlenecks), process or routing variances occur. Finally, working time variances occur when more or less time than calculated is used to process a production order in the production cost centers.

All these types of variances must be reported to the production managers, as they are the only ones who can directly ensure that such variances do not occur. Therefore, these variances are not allocated to the units produced and are not reported in the product contribution margins. The variance analysis for the production orders shows by how much the actual costs of the orders produced deviate from the planned costs per unit. Added to this are the spending variances of the production cost centers. Avoiding such variances is the responsibility of the production manager and of his cost center managers.

If differences arise between planned and paid prices in purchasing, purchase price variances occur. For these the purchaser is responsible, not the consuming cost center. Only if the material is purchased directly for a specific production order can a purchase price variance be charged to the order according to its cause. This type of variance arises at the moment of purchase, not at the moment of consumption, see also the post “Standard Cost Calculation of Products“.

These in-depth target to actual comparisons are used for control during the year, so that the responsible persons can quickly determine corrective measures. For the provision of data for the balanced scorecard, the condensed information on services rendered and the recalculated actual costs are usually sufficient.

It follows that the management accounting system, which has been consistently set up in line with decision-making and responsibility, also provides the data required for the implementation of the BSC. Full cost accounting, in which fixed costs are allocated to inventories and from there to the units sold, is not suitable for supplying a BSC. This is because the allocations mean that the people responsible only see to a very limited extent, or not at all, which of their measures had a direct impact on improving process costs.

The combination of stepwise and multidimensional CM- accounting with standard cost accounting with proportional costs leads to clear interfaces between the individual management areas.

Origins of the actual BSC-data

Only the comparison of the achieved results with the decided objectives enables the assessment of success and thus the application of the Balanced Scorecard. It is therefore necessary to check whether the data generated in the applications of the management control system can also enable the evaluations required for a BSC.

Origins of the actual BSC-data

We divide this examination into five areas:

    • Projects
    • Products
    • Support processes
    • Sales process
    • Integration with contribution margin and profitability accounting.
Products

Process improvements are expressed by the fact that the output can be achieved with less input. This is true both in the medium-term and in the year-by-year view.

Process improvement is mainly a technical consideration: Can one product unit be produced with less material and external activity input and/or with less labor input in the cost centers, and is investment in equipment required to achieve the process improvements?

The data required for this are contained in the bills of material and in the routings of the ERP system as planned quantities and times to be achieved. The investments are recorded in the corresponding investment calculation.

In the management accounting system, the material and the consumptions of external activities  are valued using standard value approaches and the work activities in the cost centers are valued using proportional planned cost rates. This results in the proportional standard cost of goods sold. All variances from the standards are shown in the final costing for each production order according to the cause of the variance (purchase price, material quantity, yield, scrap, lot size variance). The consumption variances arise in the target to actual comparison per cost center.

This description also applies analogously to directly customer-oriented service areas and to research and development areas.

In management accounting, the focus is on the target-oriented control of products, production orders and cost centers. To measure improvements in the process- and financial perspective, this actual data is condensed differently in the BSC depending on the issue. Consequently, the data used in a BSC is more highly aggregated than in management accounting.

Example: A productivity improvement target is included in the process perspective of a BSC:

The output/input ratio of a cost center is to be improved, the average costs per unit are to be reduced. Because in this cost center different products are manufactured on the same equipment, the different items must first have the same denominator. To do this, the costs of the products under consideration are divided by the quantities manufactured and the resulting value is transferred to the BSC.

However, to plan and control the improvements, the cost center manager needs data of the individual products and of the engaged cost center. This data is only available in the ERP and in the management accounting system. Additionally, he must know which costs are directly caused by the produced quantities (proportional costs) and which are the consequences of the capacity and the readiness to perform of his cost center (fixed costs). This is another reason why we recommended splitting costs into proportional and fixed when planning a cost center.

Supporting Processes

Support processes have to ensure that R+D, production and sales as well as management tasks can work properly. These tasks mainly concern the BSC perspectives of potentials and processes.

Support processes are mainly carried out in the cost centers of the functional areas:

    • IT
    • Maintenance / repairs / energy supply
    • Plant management
    • Purchasing / Warehouse
    • Personnel administration
    • Internal training and education
    • Controller
    • Finance / Legal Service

These areas ensure that the organization is ready to perform. In part, the service recipients (cost centers) can determine which and how much services they want to receive. This is largely the case for IT, maintenance, energy supply and workshop areas. In asset management, the purchases of buildings, machines and equipment are recorded and charged to the using cost centers on an accrual basis by means of imputed depreciation.

All other support processes are compulsory consumption from the recipient’s point of view and consequently cannot be charged to the users according to their cause (for example, software usage licenses that have to be paid for the entire company regardless of the number of users).

Insofar as services of the maintenance-, workshop-, energy- and IT-areas are the direct result of internal orders of the receiving cost centers or their performance, the proportional costs of the corresponding services can be charged to the recipients and appear there also as controllable costs. In management accounting, this requires the charging of internal services (ISP) at the proportional planned cost rate in plan and actual.

All remaining (fixed) costs in the support areas cannot be allocated to either products or customers on the basis of causation. They are to be covered by the contribution margins generated in the sales process. In the Balanced Scorecard these fixed costs of processes and potentials can partly be allocated to the perspectives but not to customers or products.

Sales process

Gross revenue from sales may be interesting for the calculation of market shares. Internally, however, and thus also with regard to their presentation in the BSC, the net revenue is relevant as this amount has to cover the total company costs and the profit. With net revenue all proportional costs of the sold units, the total fixed costs, all variances and the target profit are to be covered.

It is common that market cultivation is carried out in different dimensions. To generate sales, advertising is carried out for the entire range of products and special offers are published for various customer groups. For conversion:

    • Salespersons are employed, who look after specified sales areas,
    • Sales promotions are carried out for various product or customer groups,
    • Resellers are supported in their sales channels, and
    • Sales intermediaries (architects, engineers, medical doctors, journalists, scientists, and influencers in general) are coached to promote sales.

These efforts may be specific to different countries or territories and may relate to all or part of the product range offered.

The lowest common denominator is the billing line It shows which item was sold to which customer at what gross price and at what net revenue. This means that management accounting must structure the planning and recording of sales in such a way that both the planned and the realized net revenues can be evaluated according to the dimensions listed. The evaluation dimensions relevant to management accounting thus determine which data is to be recorded when an offer is prepared or on the occasion of invoicing. This information is relevant for salespeople,  product and channel managers as well as marketing and advertising managers.

Balanced scorecards can also be created for sales areas or product groups, but we mostly observe that the BSC is set up for the company as a whole. But the data base for the net revenue analysis in the BSC is created when invoices are issued to individual customers.

In order to assess the effect of sales promotion and other marketing or advertising measures, the controllable costs of these cost centers must be compared with the contribution margins generated. The costs of these measures are planned and recorded in management accounting. Care must be taken to ensure that no fixed cost allocations are built into the system. This is because the sales and marketing specialists can only be responsible for those costs that they themselves directly cause. At the BSC level, the development of the share of marketing and sales costs as a percentage of sales must be tracked if the effectivity of the use of resources is to be improved (% share of total direct marketing and sales costs, excluding allocations, in net revenue).

Many other factors decisive for sales success cannot be depicted in management accounting but are considered important in the BSC. Mainly through customer and prospect surveys, developments can be determined for the following sample topics:

    • Shopping experience, cleanliness, appearance, user-friendliness
    • Ease of use
    • Delivery on time
    • Accessibility and waiting queue of the hotline
    • Addressing customer complaints.
Projects

Creating the prerequisites for the realization of strategies largely requires the execution of projects. Projects are initiated because several people from different areas of the company are to work together to develop new solutions to handle processes. The first difficulty is the formulation of the assignment and the definition of the results the project members should produce. The clear task must be formulated first. This also includes deadlines to be met, the determination of the project budget and the formulation of the expected results. This is the responsibility of the ordering party. To do so they need a quantitative estimate of the achievable project benefits, a schedule and the project budget as a basis for decision-making. To prepare this budget the project planner must estimate:

    • what personnel costs will be incurred for inhouse staff and for external project staff brought in,
    • which material withdrawals are to be expected from the warehouse for the company’s own tests,
    • which services will be required from internal service areas (e.g. workshops, maintenance areas, production cost centers, information technology, legal services), and
    • whether investments in fixed assets will be necessary for project evaluation.

These estimates add up to the project budget, which is presented for decision. The corresponding services and values are to be stored as planned values in the ERP system or in the management accounting system, similar to a production order (see the post “Project Cost Planning”).

If management decides to have the project implemented, the actual consumption of the project must also be recorded in the ERP and in management accounting for the purpose of target to actual comparison. This is because management must decide at each project milestone whether the project should be continued or terminated (go/no-go decision).

Once a project has been successfully completed and released for implementation, the resulting changes in the bills of materials, work plans and cost center plans and (fixed) asset accounting must be tracked in the annual plan so that it can be measured whether the implemented project is developing successfully and the targeted improvements are actually being achieved. These changes are also to be recorded in the ERP and in management accounting so that plan to actual comparisons are possible and efficiency improvements can be measured.

Do BSC and Management Control fit?

The Balanced Scorecard is intended to measure and assess how well the strategy has been implemented during the reported period. In the Management Control System, different planning levels are distinguished (see the post “The Main Questions of each Planning Stage”). Corporate policy expresses what purpose the company should fulfill from the point of view of the owners and what guidelines for development they envisage. The strategies are developed from this. Formulated corporate policy and strategies are prerequisites for the introduction of the BSC.

Do BSC and Management Control fit
Do BSC and Management Control fit?

In the post “Strategy and Functional Concepts”, it was explained that there is hardly one common strategy for the entire company because each independent product/market combination can appear differently in its respective market. The strategic plans and goals are thus to be formulated by strategic business unit, SBU. This also corresponds to the recommendation of Kaplan and Norton in The Strategy Focused Organization, p. 45f.”.

An SBU is to be formed if different product/market combinations occur with their own corresponding pricing and offering and possibly even the unique selling proposition is different. This leads to a strategy per SBU and consequently to a specific BSC for this business unit.

In the post “Strategy and Functional Concepts”, we recommend answering six question groups when creating and documenting an SBU strategy:

Basic Idea, Framework, Assessment, Objectives, Plan of Measures, Critical Assumptions.

The objectives are the starting point for the creation of the BSC, the plan of measures is the input for operational planning. The critical assumptions are to be scrutinized when assessing whether a strategy should be pursued further, adapted or cancelled.

The agreed SBU-strategies and their objectives form the input for mid-range planning and for defining the results to be achieved in the coming year. In the functional concepts, the BSC-perspectives “processes” and “potentials” come to the fore. This is because operational planning must determine how the conditions for achieving the market and financial targets are to be created in the internal units.

This means that results to be achieved in the functional areas must also be defined as objectives. It should be possible to measure the success of implementation with the BSC.  The processes are also to be specified in a verifiable form. The intention to “expand the customer base” does not help with work planning in the areas concerned, nor is it defined how much is to be achieved and how the results achieved are to be measured. The rules for agreeing on objectives are to be applied to both strategic and operational planning. It must therefore be specified which unit (cost center) is to acquire how many new customers, by when, which criteria are to be applied so that someone is counted as a new customer, and in which year what number of new customers is to be created.

In annual planning it is important to define the results to be achieved, i.e., measurable targets, in the planning of sales, revenue, production, projects, cost centers and investments, so that progress can be measured.

Implementation of the BSC thus requires that the ideas and rules of management by objectives are applied in all areas, that the quantity- and performance-related plan and actual data are available in the ERP (Enterprise Resource Management) and CRM (Customer Relationship Management) systems, and that decision-relevant plan, target and actual data on values and inventories are provided in Management Accounting.

Overall, the BSC runs parallel to the planning stages required in the management control system. Kaplan and Norton assume the same sequence and the same contents of the planning stages as described in this blog. Based on the corporate policy and strategic definitions, the measurable short- and medium-term objectives for market development are to be derived. To realize them the personnel and material prerequisites must be created in the functional areas. This is done in cost centers and projects. The BSC measures and assesses whether these results are being achieved on time and within budget by means of target to actual comparisons.

If the management control system is set up as outlined in this blog, the planning data required for the BSC will also be generated.

The next post will analyze whether the management control system can also provide the actual data required for evaluation.

The main elements of the BSC

The guiding objective of the Balanced Scorecard is to translate strategies into actions and to measure the success of their implementation.

Whether and how successful the implementation has been can be measured by means of profitability ratios such as EBIT or – taking into account the assets invested to generate profits – with the Return on Investment, ROI. As mentioned, these metrics are only the tip of the iceberg. The drivers that lead to their achievement are found in planning and implementation efforts throughout the organization.

In their early publications, Kaplan and Norton assumed that the strategic plans were already in place and that metrics could be found to measure and assess the success of their implementation. Later, e.g., in their book The Strategy Focused Organization (2001, Harvard Business School Publishing Corporation), they focused on how to develop strategic plans and translate them into operational goals.

The Four Development Perspectives of the BSC

Recognizing that profits are the consequences of inputs, the authors defined four development perspectives of a BSC:

Finance: What returns do our owners expect on their invested funds?

Customers: How do we meet our customers’ requests while being financially successful?

Processes: How are our internal processes to be designed and implemented to meet customer needs?

Potentials: What skills, abilities, knowledge and commitment must our employees have and be able to apply in order to manage the processes, and what equipment and facilities are required to do so?

We derived the explanations for the four perspectives from various publications. It may be that other perspectives are significant in individual organizations, but it is recommended that no more than six perspectives be identified to facilitate focusing on the essentials).

Strategies as Objectives and the Measurability of Results

Kaplan and Norton recommend that the balanced scorecards be broken down to the managers and areas responsible for implementation and recorded in the form of results to be achieved. This is necessary, on the one hand, for decisions about the deployment of people and resources, and, on the other hand, to define metrics for the achievement of the objectives of the individual areas (cf. ibid., p. 360f.). This means that strategic plans and the operational plans derived from them can only be regarded as agreed objectives if it is also specified how their achievement will be measured in the individual management areas. This requirement is consistent with the rules for agreeing personal annual objectives formulated in the post “Master Plan for Integrated Planning and Control”. In other words, the BSC can only be effective if all employees know what results they are expected to achieve and how their bosses will measure them. Declarations of intent or descriptions of activities are not sufficient (see also the post “OKR: Ideas are easy, implementation is everything”).

Measurable and verifiable strategies are therefore a central prerequisite for the derivation of BSCs. Often, strategy development as a creative process and strategic planning and control are not clearly distinguished. Strategy development is based on ideas, assumptions and assessments. Once a strategy has been decided, however, it must be concretized with measurable objectives and formulated in a verifiable manner. If the plan is not documented with measurable results, it is unclear which results are to be measured and how the achieved results are to be assessed.

Balanced Scorecard and Management Control

Does the Balanced Scorecard fit with Management Control?

Robert Kaplan and David Norton developed the Balanced Scorecard (BSC) primarily because they recognized that purely money-related reporting tells us very little about an organization’s development and future chances for success.

Balanced Scorecard and Management Control

Financial reporting only shows the tip of the iceberg. Just as more than 90% of an iceberg is invisible underwater, so also the majority of the key drivers of success are invisible with only financial reporting, such as

    • the number of customers and their ordering behavior,
    • the ability to enforce prices, the ability to deliver,
    • customer satisfaction and word of mouth propaganda,
    • the skills and abilities of employees,
    • the efficiency of processes in all areas and the cooperation between the areas, and
    • coordination and managerial behavior.
Balanced Scorecard and Management Control

The iceberg as a symbol for the BSC: The most important things are invisible on the surface.

An organization’s achievements made in the “underwater area” of the iceberg are the cause of the financial success it achieves. These drivers of success must be planned and controlled first and foremost.

The successes are created with internal operational work. The BSC is intended to establish a connection between planning intentions and the results achieved in operational implementation. This should make it possible to assess in which target areas the company has developed and how well it has done so. Looking ahead, the BSC should also show which results to focus on during implementation.

The implementation of a BSC is thus largely in line with the concept of management control, as the concept states that management control should plan, steer and measure the implementation of guidelines, strategies and operational goals (see definition).

The following posts explain how the management control system can provide BSC-relevant data.

Planning takes too long

Many executives complain that planning takes too long. This is normal. After all, planning work takes time,

    • which is lacking in selling, producing, administering,
    • is needed for dealing with the uncertain future and making assumptions,
    • is needed for mutual coordination and scheduling, as well as
    • is needed to determine what results are to be reached, when they are to be achieved, and what must be ready for that to happen.

Just working ahead is less challenging than agreeing on objectives and planning to achieve them. But without planning, overarching coordination is lacking and results, up to and including the payment of salary, become haphazard.

Integrated and comprehensive planning is a prerequisite for the survivability of any organization (including a family). The question is which planning content is relevant and when, and how to schedule the planning process in the annual calendar so that the desired results can really be achieved.

Planning takes too long

Those who are to determine objectives or plan values want to know the actual state, i.e. the starting point, and the near future to be expected as precisely as possible. This leads to delaying the definitive determination of objectives as long as possible. It is therefore advisable to record the various sub-plans with their required completion dates in a planning calendar.

If the complete development of the plans is calculated back to annual targets and plans starting from the release decision, the following ideal-typical planning calendar results (assumption: fiscal year = calendar year):

Planning takes too long
Planning calendar
    1. In order to be able to start tracking the new targets right at the beginning of the year, the annual objectives for each person should have been agreed and released at the end of the previous year. In order for the Executive Board or the Board of Directors to be able to give this release, the mutually agreed objectives and budgets of all levels and areas for the next year must be known in good time. This release usually takes place shortly before Christmas. If the top management bodies approve the submissions, this means the release of the following year’s targets and plans at all levels.
    2. The actual annual planning should therefore begin in September, as it requires the most coordination and therefore also the most time. Because it is necessary to plan from the sales markets into the company, it follows that sales/revenue planning is at the beginning. By the end of October at the latest, the planned net revenues, the capacities required (personnel and equipment) and the main projects for the following year should be determined so that cost center planning and the consolidation of the plans can take place in November. For this purpose, the planned prices for goods and services to be procured must also be determined by the end of October so that standard cost calculations are possible. The transmission of the entire planning to the top management or to the administrative and supervisory boards must take place in the first days of December so that the latter can prepare their meeting.
    3. The updated medium-term planning must be ready before the summer break (around the end of June) so that the management can decide on it and so that the controller can publish the planning letter with the basic principles and key figures for the next annual planning by the end of August. Consequently, the medium-term planning should be updated in May/June (especially multi-year projects, R+D orders, capacities, training and further education, investments), as it contains essential benchmarks for the next annual planning.
    4. This requires that strategy revision has to take place in March and April. Top management and the Administrative/Supervisory board must approve the updated strategies, because they in turn provide inputs for medium-term planning.
    5. In February/March, the final financial statements for the previous year are usually ready for approval by top management. At this meeting, it is also important to update the corporate policy (management concepts, vision and mission statement), as any changes have an impact on strategic planning.
    6. The forecasts provide an essential input for the preparation of the budgeted accounts, especially with regard to expected sales and purchase prices. Preparing forecasts means drawing up estimates of price and volume changes in the sales and procurement markets, which is also time-consuming. Consequently, managers must be burdened as little as possible with forecast preparation. Contrary to the accounting standards for listed companies (IFRS and US GAAP), which require a forecast every quarter, we recommend that only two forecasts be commissioned annually:
      • The first should be prepared on the basis of actual data from January to April, because Easter is celebrated once in March and the other time in April.
      • The second forecast is to be prepared on the basis of actual data from January to August, because this is when most of the vacations are taken. This second forecast thus also forms an important input for the planning of the next year, which should begin in September as described.
      • There is no need for a further forecast, as this would refer to the first four months of the planned year. However, the corresponding data are already included in the annual planning.

The need for forward thinking means that managers at all levels are involved in planning for most of the year. This is because ensuring that the skills, capabilities and resources are available on time requires different lengths of time as well as answering different questions in the planning stages to process the determinations in the planning stages.

Establishment of the parallel blog Management Accounting

Parallel Blog “Management Accounting”

The Management Control system is so comprehensive that there is a risk of losing track of it in this blog. To make it easier to find the individual contributions, we have therefore decided to set up a parallel blog.
It is called “Decision-relevant Management Accounting” and contains the contributions on Management Accounting and Controllership.

This parallel blog is available now. You will be automatically redirected via the menu bars and the topic structure.
The blog “Decision-relevant Management Accounting” can also be reached directly via: https://management-accounting.us.