Job Satisfaction

Job Satisfaction

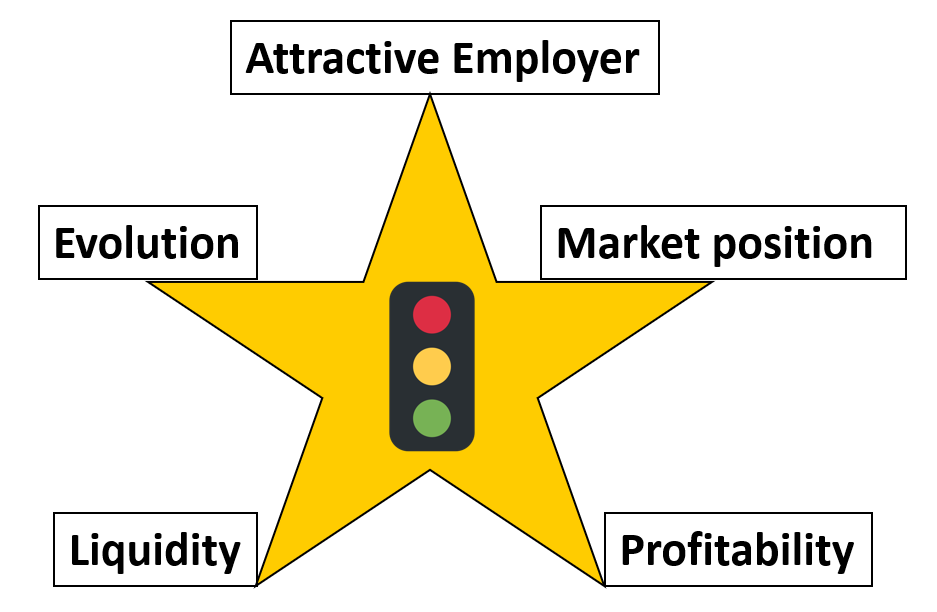
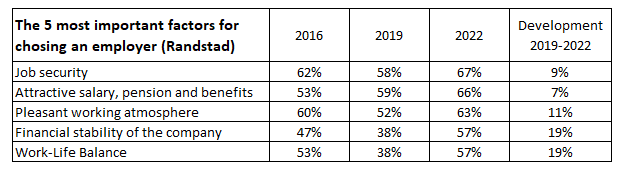
Job satisfaction greatly increases employer attractiveness.

According to the Swiss Federal Statistical Office FSO, more than 100’000 job vacancies were available in the first quarter of 2022 – primarily in the industrial and service sectors. In particular, the rising trend of a lack of skilled workers is causing concern in many places. In the wake of this worsening shortage of employees it is worth paying increased attention to job satisfaction in the Top Control “Employer Attractiveness“.

Many companies now employ a large number of experts to identify and attract good new employees and retain them in the long term. Corresponding HR processes have long since found a place on the strategic maps of many companies. Initiatives range from “active sourcing,” to “finder fees” for employees or the abolition of application letters, to in-house mindfulness trainers, initiatives in corporate health management, flex-work offers or vacation purchase programs.

These offers may have their justification and certainly support the retention of employees in a company. In my experience, however, they now tend to have the quality of “hygiene factors” – especially for high-performing and marketable (knowledge) employees – and are thus part of the mandatory program of every company. There is hardly any real differentiation here anymore.

Managerial behavior

As a rule, employees are seldom dissatisfied because the fruit basket or the table football box in the office are missing.  Statistics show that the behavior of the direct supervisor contributes significantly to job satisfaction. A survey of almost 3,000 persons confirmed that 62% of all respondents had already quit once because of their supervisor(s) (cf. Information Factory, 2014).

Managerial behavior of direct supervisors is the key factor of employer attractiveness.

However, my experience shows that people-related lmanagement tasks are still neglected in many companies. Many managers at all hierarchical levels only devote themselves to their employees when,

    • the performance appraisal interview is imminent,
    • employees in their own management area attract negative attention,
    • cooperation does not work as desired,
    • new rules and processes are introduced in the company,
    • costs are to be reduced or processes are to be changed.

Because adjustments to changing requirements are part of normal everyday life in any company, it is important to continuously support ones own employees in such a way that they can deal with these changes and still enjoy their tasks. One starting point for this is “psychological empowerment.”

Psychological empowerment

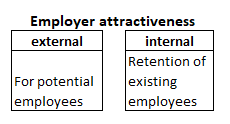
Referring to the statistics on internal employer attractiveness (Factors of Internal Employer Attractiveness (Trend Study Employer Attractiveness (topjob.de)), the managerial behavior of “psychological empowerment” is discussed here in more detail.

Empowerment means self-enabling, strategies and measures intended to increase the degree of autonomy and self-determination. The purpose is to give employees more possibilities to shape their interests and their social environment themselves.

Studies show that psychological empowerment goes hand in hand with a particularly proactive attitude towards work (see Spreitzer G. (1995). Psychological empowerment in the workplace: dimensions, measurement, and validation. Academy of Management Journal, 38, 1442-62.)). It was also shown that psychological empowerment is associated with greater job satisfaction and higher performance as well as with stronger retention and commitment (see. Seibert, S. E., Wang, G., & Courtright, S. H. (2011). Antecedents and consequences of psychological and team empowerment in organizations: A meta-analytic review. Journal of Applied Psychology, 96, 981-1003).

Similarly, positive evidence on employees’ mental health and innovation behavior has been demonstrated (Chermuly, C.C. (2023). Empowerment: strengthening and developing employees. In: Felfe, J., van Dick, R. (eds) Handbook of employee leadership. Springer Reference Psychologie, Springer, Berlin, Heidelberg.).

The approach assumes that four work-related factors constitute the experience of psychological empowerment (see Spreitzer, 2008):

    1. the experience of competence (occupational self-efficacy)
    2. meaningfulness (meaningfulness and intrinsic motivation, i.e. motivation coming from within)
    3. self-determination (autonomy in the execution of activities)
    4. influence (degree of power that employees assume during the performance of the activity, belief in the ability to influence one’s own work results).

Relationship design is central

Psychological empowerment requires trust, employee orientation and appropriate organizational communication. Furthermore, it can be influenced by targeted and clearly defined personnel development processes and offers, meaningful work design, strength-oriented use of competencies, and specific person-related managerial practices (different for each employee).

The focus is on building a relationship with each collaborating person. People and their individual perspectives must become the focus of managerial behavior. Only then can genuine empowerment take place – instead of excessive demands or the rigid pursuit of command chains. This requires above all time, an appropriate attitude and a conscious and competent use of specific discussion techniques (including active listening, questioning techniques, coaching elements) from the respective manager.

In my experience, these basic requirements are still neglected in many organizations. We often hear phrases from managers such as, “People management is important to me but I don’t have time for it.” Those who do not perceive relationship building as a priority and elementary management task will therefore hardly be successful in the long term. Only those who take the perspectives of employees into account and involve the persons in their own team individually will benefit from the positive effects of psychological empowerment and thus make a “real” contribution to internal employer attractiveness.

Employer Attractiveness

Whether employees come and stay is mainly due to leadership behavior and incentivizing work content.

Employer Attractiveness

Employer attractiveness is understood as an organization’s power to attract applicants for positions to be filled and to retain key employees. As a result, a distinction must be made between external and internal employer attractiveness. The factors that make a company appear interesting to potential employees generate external employer attractiveness. Factors that promote the loyalty of existing employees are elements of internal employer attractiveness.

Employer attractiveness

External Employer Attractiveness

In an online survey in early 2022 by Randstad Employer Brand Research of 3,727 employees and job seekers aged 18 – 65 in Germany, respondents were asked about the five most important factors to them. The results, with comparable results from 2016 and 2101, are indicated below.

5 most important factors to choose an employer
The 5 most important factors to choose an employer

The change over time shows that while there are minor shifts in rank, partly caused by the COVID pandemic, the top 5 attractiveness factors remain the same.

Other surveys show the same five attractiveness factors as most important. For example, the opinion research institute Innofact AG conducted in May 2019 an online survey of 1,006 employees as well as apprentices and students representative for the German population. The survey produced the following ranking:Employer factors students and apprentices
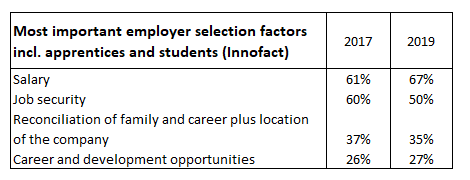
Employer factors for students and apprentices

Attractive employers for career starters

In 2015  https://berufsstart.de  investigated which characteristics companies should have to be perceived as an attractive employer by students, including graduates as well as young professionals.

In that study, in addition to the so-called hard, primary factors, the soft characteristics – the secondary features for the popularity of employers were determined for the first time. It was found that among the hard factors, opportunities for further training (88%) and opportunities for promotion (79.5%) enjoy the highest priority when choosing a suitable employer. For three quarters of all participants, the image of a company is the third most important factor. International orientation and job security are also given high priority.

Social benefits and infrastructure are rated by career starters as rather insignificant for employer attractiveness. Among the desired secondary features, the working atmosphere was considered with 91.2% the most important “soft” factor for the attractiveness of companies. Working atmosphere is always an essential basis for employee satisfaction and collegial cooperation. Varied activities (76.7%) as well as work-life balance and responsibility were almost equally important. For one-third of the career starters, family friendliness was a key reason for preferring a company. Less important for the choice of company were “flat hierarchies, benefits and leisure activities”.

Source (22.05.2022): https://zvoove.com/blog/was-bewerber-bei-unternehmen-schaetzen-die-attraktivsten-arbeitgeber-2015-studie-berufsstart-de

Main factors for employee recruitment

From the rankings and assessment priorities shown, a catalog of the ten most important aspects of external employer attractiveness can be derived. Without claiming to be exhaustive, the catalog is structured here according to the dimensions of AMPLE:

Working conditions

      1. Leadership behavior and processes
      2. Promotion and career opportunities
      3. Acceptable workload / flexible working hours
      4. Work-life balance, family and career
      5. Attractive location (commuting, buildings)

Profitability and Liquidity

6. Competitive compensation and benefits

7. Profitability and financial stability of the company

Evolution

8. Challenging employment, further training opportunities

Market position

9. Good products and services of the company

10. Good reputation of the employer

It is thus understandable that job offers (print or electronic media) should include information on these 10 attractiveness factors. Interested parties should be encouraged to ask more in-depth questions about these factors during interviews. The relevant documentation will probably mostly be prepared by the HR-department, but the points mentioned should also be addressed in the direct discussions between applicants and future superiors.

Internal Employer Attractiveness

It pays to do more for your own attractiveness as an employer!

The Institute for Leadership and Human Resource Management (IFPM) at the University of St. Gallen / Switzerland conducted extensive surveys and studies on internal employer attractiveness in 2015 and 2021 (this Top Job Trend Study can be downloaded at Trendstudie Arbeitgeberattraktivität (topjob.de). In 2021, 13,400 employees from about 100 companies of various industries and sizes were surveyed, 61% of whom were male. 20% of respondents were managers. 92% of the respondents were born between 1950 and 1996 (Baby Boomer, X and Y generations).

Qualitative comparisons between companies with high and low measured employer attractiveness were obtained by interviewing the executives. It was found that the group of companies with high employer attractiveness scored around a quarter better in terms of sales growth and employee innovation ideas generated. The proportion of employees’ productive working time was around 20% higher and the ROI achieved was also around 20% higher compared with the companies with low employer attractiveness.

Factors of internal employer attractiveness

When examining factors to increase internal attractiveness, it should first be noted that all employees perceive their reality subjectively and that emotional and action-related factors often have an unconscious effect.

Therefore, it is difficult to define universally valid catalogs of attractiveness-enhancing actions. However, many positively impacting behaviors can be derived from the literature and especially from comments made in interviews about the choice of the most attractive employers. From the presented empirical analyses above we derive the ten most important internal attractiveness factors (see also https://qualitrain.net):

    1. Management style and feedback culture of superiors
    2. Measurably formulated objectives to be achieved and explanation of their significance
    3. Degrees of freedom in implementation
    4. Measurement/assessment of achieved results (target-performance comparison) including verbal and written recognition
    5. Learning opportunities at the workplace
    6. Further training offers, also with regard to soft skills for interpersonal interaction
    7. Career opportunities within the company
    8. Work at home
    9. Reconciliation of work and family care
    10. Joint activities (where people meet and exchange ideas).

These factors are – according to the cited IFPM-survey – not really time-dependent. In our opinion, they represent the needs of employees that need to be met so that they feel comfortable in the company and want to engage themselves to achieve the company’s goals.

This requires that all managers, from top management to cost center or team leaders

    • regularly explain the corporate goals and the strategic objectives for each business unit,
    • agree on the annual objectives so that they know which results are important,
    • discuss the achievement of objectives at least twice a year and, if necessary, agree on corrective measures,
    • acknowledge and thank employees for the results achieved in the past months and the efforts made to achieve them,
    • take up the suggestions for improvement from the meetings and assess their feasibility or initiate their implementation, and
    • take up and process the comments of the interviewed persons concerning internal cooperation.

The main factors of internal employer attractiveness are thus mainly realized through the performance of people-related management tasks.

The financial compensation for work performed is still the most important and most easily comparable decision-making factor in all employee generations (from the baby boomers, birth years 1950-1964, to Generation Z, birth years 1996-2010) (see above).

Profit in Line with the Market

Does your company generate a market-driven rate of return? Companies, especially SMEs (small and medium enterprises), find here the calculation basis (figures for German-speaking countries and the US). Does your company generate a profit in line with the market?

What is market-driven profit?

When investing your money in a company, you ask yourself whether this company achieves a profit in line with the market. For this to be the case, profit must correspond to the return that can be earned when investing in other companies with the same level of risk.

Consequently, a company should generate at least enough profit to cover the interest requirements of the lenders of the borrowed capital and an adequate return on capital to the owners of the equity provided. The part of the assets financed with “interest-costing capital” must earn the interest that meets the interest requirements of all capital providers. It is referred to as capital employed and results when free capital is deducted from the assets required for operations. Free capital is that part of debt which is available to the company without paying interest, i.e. debt to suppliers, advance payments from customers and non-interest-bearing provisions.

Profit in Line with the Market

For the total capital employed, an interest rate is sought which should remain for the investors after deduction of all costs, i.e. including income taxes. This risk-based and thus market-based interest rate is referred to as the weighted average cost of capital (WACC).

Calculation of the Weighted Average Cost of Capital (WACC)

Four variables are required to determine the WACC:

    1. the cost of equity,
    2. the cost of debt (capital)
    3. the income tax rate, and
    4. the ratio of debt to equity (gearing).
Determining the cost of equity

From the owner’s perspective, the cost of equity represents the return (yield) he would earn if he invested his money in an alternative investment of equal risk and duration. This means that the shareholder would like to receive at least the risk-free interest rate plus a risk premium. Since equity is a long-term form of financing, the risk-free interest rate of a long-term form of investment must be applied. In practice this is often the interest rate for 10-30-year AAA-rated government bonds.

Tip: Use the risk-free interest rate from the annual KPMG Cost of Capital Study. In this study, it is given as 0.40% for 2020 and for Germany. (Internet links at the end of this post).

There will hardly be an investor who would make his money available to a company at the current risk-free interest rate of 0.40%. Since the owners share the complete risk of loss of the company, they demand a risk premium.

It is obvious that equity investors again look to the capital market to determine the risk premium rate by analyzing what return a certain broad stock index, e.g. CDAX, S&P 500, MSCI World Index, yields. The difference between the return of the chosen benchmark stock market and the risk-free rate represents the market risk premium that an average investor demands when investing in a stock.

Tip: Use the market risk premium from KPMG’s annual cost of capital study. This is given as 7.20% in the KPMG Cost of Capital Study 2020 for Germany.

The market risk premium represents the risk premium for the entire market. It is too flat for a specific company. Therefore, it has to be corrected depending on whether the company has a higher or lower risk than the average stock market. This correction factor can in turn be derived from the stock market and is called a beta factor. In practice, beta factors are calculated for different industries. The cost of equity for an average German company (beta factor = 1.00) is therefore 0.40% + 7.20% = 7.60%. For internationally operating companies, it is common to add a country risk premium to the cost of equity.

Tip: The industry beta factors can be found in the annual KPMG Cost of Capital Study. Use the “average levered beta factors by industry”. When in doubt, use the beta factor for an average company, which is 1.00. For those who want to know more, refer to our book 360°-MANAGEMENT, Appendix B (in the Bibliography), and the literature cited there.

Determining the cost of debt and the income tax rate

The cost of debt is usually the interest that the company is currently paying on long-term debt. It should be noted that the interest rates applied to borrowed capital must always be higher than the long-term risk-free interest rate plus a risk-adequate premium (spread) for the credit default risk (depending on the rating class of the company). Since interest on debt is tax-deductible and thus reduces tax expense, the cost of debt is adjusted downward by the tax rate.

According to the KPMG Cost of Capital Study 2020, the average cost of debt used for Germany was 2.20%. The average tax rate for Germany 2020 is 30.00% (KPMG Corporate Tax Rate for 2011-2021). The net after-tax cost of debt for an average German company is therefore 1.54%.

Tip: For a rough calculation, divide the total interest expense by the interest costing debt. For taxes, use the income tax rate you pay.

Determination of Debt

The final step in calculating the WACC is to determine the ratio of equity to debt. Since the market value of a company is the sum of the market value of the interest-bearing debt and the market value of the equity, the proportions must be determined at market values.

In practice, the book value of debt is usually used as the market value of interest-bearing debt. The market value of equity (shareholder value) is relatively easy to determine for listed companies by multiplying the number of shares by the stock market price.

Note: According to the KPMG Cost of Capital Study 2020, the average debt to equity-ratio used is 28.90% (w). This corresponds to an equity ratio of 77.58% (u).

Tip: For simplicity, subtract interest-bearing debt from capital employed to get the equity. The equity ratio is the ratio of equity to capital employed.

Determination of WACC and Target ROCE

Based on the previous calculations, the WACC rounded to half percentage points for an average German company is 6.00% (y). Since ROCE is calculated on the basis of EBIT and is therefore a pre-tax figure, the WACC still has to be corrected for the tax portion. The target ROCE for an average German company rounded to half percentage points is therefore 9.00%.

Note: For 2013, the author calculated an average Target ROCE of 10.00% for Germany. The target ROCE has remained relatively stable. For Switzerland, the target ROCE is 7.00% and for Austria 9.00%. The Target ROCE was in the US 7% for 2020, using the calculations of Prof. Damodaran (cf.: https://pages.stern.nyu.edu/~adamodar/New_Home_Page/data.html).

Tip: Round the WACC and Target ROCE to the nearest half percentage point and only make adjustments if the cost of capital has changed by more than one percentage point.

Was an Excess Economic Benefit achieved?

To determine the target ROCE of a specific company, the requirements of the capital market are applied to the company to be assessed. The profitability achieved by the company is compared with the risk-weighted market expectations.

The target ROCE is thus a hurdle rate, used to assess the profitability of the company as a whole in comparison with the equity market, but also serves as a yardstick for assessing strategies and investments. For this reason, the target ROCE must be an integral part of the corporate financial concept and of the top control “Profitability”.

Enough EBIT achieved?

In the example, the company has achieved an EBIT of 100,000 (f). If the EBIT is divided by the capital employed (c), the realized ROCE is 10.00% (k). The company thus achieved a higher return in the last period than the 9.00% target ROCE required by the market (aa). If the target ROCE is multiplied by the capital employed (c), the target EBIT is 90,000 (l). An “Excess Economic Benefit” of 10,000 (m) was generated. This is the most important parameter for assessing management performance in terms of profitability. The ” Excess Economic Benefit” shows the increase in value of a period as an absolute amount.

Management has three decisive levers at its disposal to increase the “Excess Economic Benefit”. Firstly, to generate as high an EBIT as possible, secondly, to require as few assets as possible for this, and thirdly, to finance the assets required for operation with as much free capital as possible. A modern management accounting system supports managers in this.

Download this Excel model free of charge under “Free Downloads”. To adapt it to your own figures, please enter the password shown in the exhibit above.

The Cost of Capital Study 2020 – KPMG Germany can be downloaded here.

This post is an updated summary of Appendix B in the book 360°-MANAGEMENT (by L. Rieder and M. Berger-Vogel, see Bibliography).

Coordination

Coordination

We understand coordination as the alignment of processes to achieve a result on time. Decision-makers and implementers in an organization coordinate objectives, capacities, available resources and the rules of conduct of all participants in such a way that the overall organization acts successfully in the long term and meets the relevant customer and environmental needs. This work takes place within the body of the AMPLE-star.

Coordination
Coordination of the 5 top-controls Attractivity, Market Position, Profitability, Liquidity and Evolution
Coordination takes place in more or less detailed structured processes.

Examples of highly detailed processes:

    • Receipt, processing and execution of a customer order
    • Triggering, processing and measurement of a production order with final stock receipt
    • Placing an order with a supplier including receipt of the delivery, recording of the necessary data and storage in the warehouse
    • Preparation of payrolls including posting and payment
    • Hiring of new employees and recording of all personal and payroll-related data
    • Sequence of generating, negotiating and deciding objectives.

Less detail is often given to processes that deal with changes in the company’s environments or involve more than one of the 5 top-controls:

    • Revision of corporate policy and strategic planning
    • Establishment of research and development priorities
    • Education and training programs for the workforce and managers
    • Decisions on marketing and sales promotion programs
    • Establishment of internal success potentials relevant to the strategies.
    • Definition of “right of way” rules for decisions affecting several areas, e.g. local sales organization versus central product management.

Coordination is particularly important when decision-making competencies are not fully regulated and/or different interests conflict. This happens during finding and fixing objectives, during implementation, and when corrective measures are defined. To this end, it is advisable to determine in advance which person is to assume the arbiter function. This does not always have to be the next higher superior. Specialized personnel or external persons of trust can also assume this function.

The quality and accuracy of the data required for decision-making is central to coordination. If all parties involved in the decision process receive the same and complete data, this usually creates a clear starting position.

Enterprise Resource Planning (ERP) Systems and related systems such as Customer Relationship Management (CRM), the whole accounting applications and the aggregating management accounting (cost, activity, revenue and profit accounting) should provide the data relevant for decision making. This applies to planned and actual values as well as to the derivation of estimates. Corporate policy and strategic determinations as well as descriptions of the content of plans and projects often cannot be documented in the standard applications mentioned. Spreadsheets as well as text and image-based applications are (still) better suited for this purpose.

Because coordination requires a lot of time, it is advisable to provide time-windows for mutual coordination, especially in the planning calendars (strategic and operational).

Liquidity

Not able to pay on time = bankruptcy

Liquidity is essential for the survival of any organization at any time. That is why liquidity is one of the five top-controls (see the post “AMPLE for sustainable success“).

Liquidity

An organization is liquid if it is at all times able to execute all mandatory payments on time. If it fails to do so, it must by law declare its insolvency, which leads to bankruptcy proceedings and in most cases to the dissolution of the organization.

Consequently, solvency must be ensured at all times, both in the short term (day, month, year) and over several years, taking strategic developments into account.

Banks and similar institutions can become insolvent on a more or less daily basis due to large incoming and outgoing payments, because large outgoing payments can occur one or more days before the (re)receipt of expired loans. Thus, in banks, daily tracking of payment readiness planning is essential. In most other companies, monthly planning of cash flows is sufficient.

The scope of insufficient planning, monitoring and control of one’s own liquidity situation in a business context can be seen from the annual analyses of the Austrian credit protection association KSV 1870, https://www.ksv.at/PA%20Insolvenzursachenstatistik%20Unternehmen%202019. As a creditor protection association, KSV analyzes insolvencies in Austria (around 3,000 every year) and classifies them according to cause. The analysis for 2019 revealed the following order of insolvency causes:

    • 42.6% are consequences of operational deficiencies (weaknesses in sales, financing and liquidity, planning and control systems)
    • Around 21% are consequences of start-up errors (including lack of industry know-how, inexperience, insufficient business training, insufficient start-up capital)
    • Around 10% are due to neglect of actual management duties.

According to the KSV findings, it is typically the boss who is responsible for insolvency and not the competition or the environment. This result holds true for young companies (up to 5 years old) as well as for longer existing organizations.

These statistically proven findings indicate that regular system-based planning and tracking of liquidity may not be neglected. The impact of short- and medium-term planning of quantities, activities, costs and net revenues on cash flows must be mapped so that correct and informed decisions can be made.

The following example illustrates how, and on the basis of which basic data, a monthly updated readiness-to-pay plan can be created. The initial data are, on the one hand, the immediately available cash and cash equivalents that will be in the books at the beginning of the planned year and, on the other hand, the planned profit and loss statement (planned P&L) of the upcoming year. Their creation can be traced in the simulation model for the book “Management Control System”.

From the planned sales, if the average duration between outgoing invoices and incoming payments is known, it is possible to calculate after how many days the invoiced sales lead to cash receipts (example: on average, customers pay 35 days after outgoing invoices). This means that January sales do not become cash until the second half of February). From the other items of the budgeted P&L, the cash outflows for wages, social benefits, raw material purchases and all other types of expenditures can be derived (the payment period granted by suppliers leads to a later outgoing payment). In addition, there are changes resulting from new investments, increases or decreases in inventories and expiring third-party loans, as well as payments for dividends and other distributions. These can be taken from the budgeted balance sheet (ibid.). A complete example of a willingness-to-pay plan can be found in the “Controller’s Guide”, p. 317ff.

If it is foreseeable that the stock of immediately available cash will tend towards zero, the CFO must ensure that banks or other lenders commit to providing corresponding additional funds. These are usually newly committed credit lines. The company will only use them when it needs them, since they cost interest. Committed credit limits are entered in italics in the corresponding line in the example model. This results in the amount of immediately available cash for each month end after taking into account all cash inflows and outflows of the planned month.

readyness-to-pay plan
Readyness-to-pay plan

This plan can largely ensure that the organization remains solvent in the planning year. Exceptional situations, especially as a result of a drop in sales, can still occur. The Corona pandemic is an impressive example of this. The planning CFO must therefore consider how large the safety cushion should be to maintain solvency at all times. A proven rule of thumb is that the entire personnel costs including social benefits plus the average accounts payable balance of two months can be paid from the immediately available cash. From the numerical example, it can be seen that this safety cushion does not yet exist. Consequently, the CFO is required to negotiate increased credit limits with the banks.

If the payment readiness plan can be presented to the banks during negotiations for the granting of further loans or for increased credit limits, this increases the chances of success and may help to negotiate more favorable conditions.

However, ensuring solvency at all times must also be taken into account when considering strategic plans with a multi-year horizon. This is because the necessary means of payment depend on the investments, cash-effective costs and net revenues generated by strategic decisions.

Investments in success potentials (mainly additional project costs), inventories and equipment may have to be paid several years in advance, before the sales to be generated lead to cash returns. This requires sufficient cash inflow from owners and usually increased credit limits from banks.

A readiness-to-pay budget on a multi-year basis is sufficient in this case, since the exact payment dates are not known. To prepare this budget, the expected effects of the strategic plans must be reflected in the medium-term planning. These are sales developments, product costs, cost center and, above all, project costs as well as (new) investments in fixed assets and inventories. In order to obtain reliable values, it is recommended that the process of cost center and project planning as well as product costing already be set up in the medium-term plan on a quantity and activity basis. From this, budgeted profit and loss accounts and budgeted balance sheets can be derived, which in turn find their way into the multi-year financial planning. This can be structured in much the same way as the above-mentioned payment plan. The columns then contain the plan years instead of the months.

With the procedure described, shareholders as well as the banks can see which major cash outflows are to be expected and when, and how long it will take until revenues lead to corresponding cash inflows. With this information, management’s prospects of obtaining financing for the planned development on time and on good terms with additional equity and new credit lines increase. Since uncertainties remain despite planning, credit limits with large reserves must always be negotiated.

Overall, it can be seen that volume and performance-based planning is also a central prerequisite for managing the top-control “Liquidity”. The prerequisites for this are created with the holistic management control system. In the book “Management Control System” and in its simulation model, the structure of the required system is described and illustrated, primarily in chapters 4 and 10.

Essential key figures for assessing the liquidity situation are described in the “Controller’s Guide” in chapter 7.3.

Market Position

Market Position

A company must continually find enough customers to buy (and pay for) its products and services. This requires a strong and expandable position in the market. Market position is the position that a company’s own product, assortment or even an entire company has in comparison to the offers of its competitors from the perspective of existing and potential customers.

Market Share

The most common way to assess market position is to measure market share. However, this is difficult because it is often unclear which market area is relevant for observation, which are the competing suppliers in this area and how much they sell (volumes and values).

The absolute market share is calculated by dividing one’s own sales in the area by the sales total of all suppliers.

Example of a local bicycle dealer

Own sales in the relevant area divided by sales of all bicycle dealers in the same area.

Often, the sales and turnover achieved by others cannot be collected or are only known with a delay. This makes planning more difficult and requires estimates. Good estimates are usually sufficient for strategic planning to determine the offer and the intended sales prices.

Because sales and turnover data are often lacking and above all the comparison with the largest competitors is sought, the relative market share is also calculated:

Own sales divided by sales of the largest or the three largest competitors in the same area.

The relevant data can usually be obtained from the annual reports of the market leaders.

Market share estimates are important for strategic decisions.

Large-scale statistical analyses by the Strategic Planning Institute SPI showed that market leaders achieve higher profitability in real terms (return on sales ROS) than suppliers with lower market shares (cf. The PIMS Program, Strategies and Corporate Success, by R.D. Buzzell and T. Gale, Wiesbaden 1989). Even though these evaluations are a bit dated, the relationships are still valid. This can be explained by the fact that market leaders can spread their fixed costs over more units sold than smaller suppliers. In addition, the optimization of their bills of materials, routings and batch sizes has an effect on larger production volumes, which also reduces proportional unit costs faster than those of smaller competitors (more automation, less scrap, lower setup costs).

Market share rank and profitability

The interaction of the factors listed leads to significantly higher sales profitability (Return on Sales) for the market leaders than for the suppliers with lower market shares. Especially in mature markets, the higher profitability leads to the market leaders taking over the smaller competitors with the money they have earned, resulting in higher concentration. Notice that the customers rank the product quality of the market leaders higher than the quality of the followers.

The example of the automotive industry illustrates this development:

Market position in the worldwide automobile industryy
Market position in the worldwide automotive industry

In the meantime, Fiat-Chrysler and PSA have also merged to Stellantis. In addition, PSA has acquired Opel and Vauxhall from General Motors. The new group is estimated to produce about 8.7 million automobiles annually, ranking 4th in the world.

Large market shares also mean market power in setting technical standards and selling prices. Some examples:

    • Operating systems for Personal Computers: Microsoft Windows has a market share of about 85%, Apple’s MAC OS about 18%, Android increasing (praxistipps.chip.de)
    • Cancer drugs: Roche, Pfizer, Johnson and Johnson (statista.com)
    • Internet search engines: Google (92%), Yahoo (2.7%), Bing (2.4%), Baidu (in China 64.5%) (indexlift.com)

In the strategy development process, it is therefore necessary to compare one’s own market position with that of the market leaders in the intended offering area. This applies to a small local business as well as to large corporations. The market analysis must reveal which are the decisive providers in the catchment area and with which offers they achieve the greatest success.

As shown above, market position also has a significant influence on unit costs. The larger the market share, the greater the chances of achieving more favorable average unit costs than competitors. To penetrate these relationships, some posts on the experience curve will also be published in this blog.

Customer Value

It is important to achieve a significant market position in the served market and, in the eyes of the (potential) customers, a higher relative product quality. With a strong market position the average cost per unit should sink in the medium term. This is one of the reasons why market leaders can become more profitable.

Profitability

Continuous increases in productivity are the prerequisite for increasing profitability within the company.

Profitability refers to earning power, i.e., the ability to generate recurring profits in the short and long term. From a holistic perspective, profitability has two main elements: profitability and productivity.

Profitability

A ratio of two value measures, e.g., earnings before interest and taxes (EBIT) divided by assets used to generate EBIT (return on assets or return on investment ROI). Because in Management Control the inner workings of a company are the starting point, we deliberately refer to return on assets, because it is the use of assets that generates profitability. The return on capital is the view of the financiers.

The ratio ROI tells how many cents of EBIT remain for each EUR invested.

This can also be related to sales: EBIT divided by invoiced sales = return on sales (ROS).

Example:

1 million ring binders are sold at EUR 4 (= 4 million sales) and total costs of EUR 3.6 million are incurred for this, resulting in an EBIT of EUR 0.4 million and thus a return on sales of 10%. If, by improving internal processes in year 2, the number of employee hours to be used, the material input or the costs for machinery and equipment worth EUR 0.16 million can be reduced, the return on sales increases from 10% to 14% and the ROI from 20% to 28%.

Profitability and productivity

Profitability and productivity

Productivity

A productivity metric is a ratio between output and input quantities, e.g., number of units sold divided by the labor hours required to do so in the overall company (labor productivity). Because employee performance, machine input and money input can change the output / input ratio, all factors of the ratio must be made equal. The easiest way to do this is with monetary values.

The productivity increase in the example is 11.11% (for the 1 million ring binders, costs of 3.44 million EUR were incurred instead of the previous 3.6 million, i.e. 11.11% more productive output).

The profitability figures include all input factors (employees, raw materials, external services, equipment) with their prices, which means that price changes in the procurement markets have a direct impact on profitability. Productivity improvements on the other hand show that an output unit was furnished with fewer input means.

It is to be concluded that an organization must concentrate above all on productivity increases if it wants to survive in competition and be sufficiently profitable. In simple terms, it is necessary to look for opportunities to produce and sell more units with the same number of personnel and equipment.

Experience curve

The experience curve provides empirical evidence of the importance of productivity gains. Bruce Henderson (see literature) has analyzed the relationship between productivity and profitability with his empirical studies of input/output-ratios for a wide variety of products and markets. From this he derived the experience curve. It states that with every doubling of the cumulative output quantity, the value-added costs can be reduced by 20 – 30%. This is true for all types of organizations, including public administrations and NPO’s.

Example:

If an organization manages to process 1,200 orders with the same number of staff that is used today for 1,000 orders, productivity will increase accordingly. As a consequence return on sales and return on investment will also be higher.

Productivity increases are always to be sought everywhere. This is because it can be assumed that the competition will also try to reduce the resources used per unit of output in order to lower their value-added costs per unit and thus generate higher profitability.

Realizing the promises of the experience curve means to plan efficiency gains already in medium-term operational planning and to measure in the target to actual comparison whether these have actually been realized. If, for example, an annual efficiency target of 3% compared with the previous year is envisaged, ideas must be found on how to reduce allowed times and material consumption in production and how to reduce personnel deployment per product unit throughout the company. These efficiency objectives are to be stored in the bills of materials, work schedules and cost center plans. The improvements achieved can be measured in the management accounting system.

Evolution

Evolution requires continuous internal adaptation to new needs and developments.

Evolution

Evolution is one of the 5 top controls of sustainably successful corporate management. Under Evolution we summarize all innovations, inventions, and further developments, which change processes and structures in such a way that an enterprise can adapt sustainably and successfully to environmental changes.

Innovations and further developments can be divided into the main groups internal and external:

    • External: Invent, develop and deliver new products and services for existing customers and new markets. The main drivers are the wishes and requirements of existing and potential customers.
    • Internal: Improvements to adapt internal processes to new requirements from the various environmental spheres. This is intended to improve the company’s viability and competitiveness. The main drivers are end-to-end process integration and increasing internal effectiveness (doing the right things) and efficiency (doing the right things right).

The internal actors of innovation and development are the representatives of all functional areas. Divided again into external and internal, the following main functions emerge:

    • External: Research and Development, Sales, Product Management, Production Planning, Information Technology, Procurement.
    • Internal: Human Resources, Information Technology, Controller, Procurement, Accounting.

Innovation and development intentions are mostly implemented in projects because:

    • We have never done that before!
    • Experts from different functional areas have to contribute to find solutions.
    • Often the projects cause high investment amounts and costs.
    • The results must be available quickly and be implementable.

Project management must therefore clearly define responsibilities and accountabilities.

Evolution: Roles and responsibilities in (agile) projects

These responsibilities and accountabilities also apply in agile projects. This form of organization is recommended if there are constant changes in a project with regard to the task because the result to be achieved cannot yet be definitively defined at the beginning or the end product is not yet apparent (cf. mictrotool.de/wissen-online).

Evolutive developments arise in different subject areas

Functional-area-related development topics include:

    • Completely IT-supported sales and distribution,
    • Electronic purchasing from the search of potential suppliers to ordering and payment,
    • Cross-company online exchange of production data and technical details on inspection processes,
    • Batch tracking to localize the origin of a defect, and
    • Improved data security.

Many environmental changes also lead internally to new developments:

Social environment,

    • Flexible working hours, part-time work,
    • Work@home, and
    • Management of persons not present.

Technological environment:

    • Collaborative Robots (COBOTS),
    • Autonomous driving, drones, smart products,
    • Cable cars instead of roads and subways,
    • Designer medicines, and
    • Low-CO2 agriculture.

The example of IBM is a good illustration of evolution as a driver of corporate development. After World War II, IBM became the world’s largest computer manufacturer. The worldwide breakthrough of personal computers was also achieved by IBM, although at that time many senior IBM managers could not even imagine the need for PCs. Today, the company produces supercomputers, but its main revenues come from business consulting, software rental and cloud services.

Evolution in the environments is therefore an essential topic in the management control system of sustainably successful companies.

AMPLE for Sustainable Success

5 Top-Controls are the uppermost deciding parameters of sustainably successful organizations

AMPLE for Sustainable Success

There are five elements, or “top controls”, that constitute the uppermost deciding parameters of any successful organization. Sustainably successful companies organize themselves and thus also their management tasks according to these, which we call AMPLE for short, as described below.

AMPLE for Sustainable Success

Attractiveness for employees

Every organization must be able to find and retain employees who have the skills, abilities and knowledge to invent, develop and manufacture products and services in a customer-focused manner and to operate the necessary internal processes in line with the needs of the customers and the own organization.

Therefore, conditions must be created in the organization that appear more attractive from the point of view of existing and potential employees than those of other potential employers. Good pay is an important factor. However, surveys repeatedly show that professional and position-related development opportunities, further education opportunities, employee promotion and, above all, the purpose of the work and the way of working together are decisive.

Market position

A company’s market position improves when its own products and services generate more benefits in the eyes of existing and potential customers than the offers of other providers. Net sales price is only one factor. Rather, market position depends on whether in customers’ purchase decisions the company’s offer-benefits are ranked higher than those of other suppliers.

Profitability

The net proceeds generated must cover the costs of the entire current operation, enable the preservation of the existing substance, and achieve a return in line with the market for all investors. In addition, money for the development of future success potentials must also be earned.

Without generating these funds, a company cannot invest enough in its market position and in evolution. It will not be viable in the medium term. In order to do this it is also necessary to improve internal input/output ratios, i.e., to increase productivity everywhere and continuously.

Liquidity

If a company does not have enough available funds (cash balances or open credit limits), it can neither pay wages nor invoices due on time. This is usually the end, as only a few can avert bankruptcy. Solvency at all times must therefore be planned and controlled in both the short and the long term.

Evolution

Every company must permanently develop further and improve. Other suppliers offer existing products and services cheaper, products or services become too expensive to produce, or are no longer in demand.

Internal, especially administrative processes, must be adapted to new requirements and handled more efficiently. This requires constant innovation and improvement. Evolution is indispensable. Many formerly world-famous companies have disappeared because they did not promote their evolution with enough vigor.

A five-pointed star is chosen for the AMPLE representation to indicate that the relationships between the five elements must be brought into a fluid equilibrium if an organization is to be sustainably successful. The difficulty in this endeavor is that the interactions between the five elements can be both supporting and contradictory.

For example, if a company tries to improve its market position by granting discounts or reductions, capacity utilization in the factory increases, but due to lower net revenues per unit, contribution margins decrease and, as a result, cash flow and profit decrease. Due to the high capacity utilization, new investments in plants become necessary, but due to the lower cash flow the money for this is only available to a limited extent. Lower cash flow also means that less can be invested in evolution and that less money is available to improve the attractiveness of jobs. AMPLE will fall out of the flow equilibrium and, if countermeasures are not taken in time, insolvency will occur in the medium term.

Further explanations of our AMPLE can be found in section 1.1. of the book Management Control with integrated Planning, chapters 1.1 and 2.