BCG-Matrix

BCG-Matrix

Bruce Henderson and the Boston Consulting Group developed the BCG -matrix in 1970. It is intended to support strategic planning and management of companies with different products or business areas as well as different market areas. In the widely known four fields

    • Question Marks (question marks ?)
    • Stars (products with a high market share in growing markets)
    • Cash Cows (Dairy cows)
    • Poor Dogs (discontinued products)

all product or service areas of a company are entered so that the product/market portfolio can be recognized.

To determine the appropriate field in the portfolio, information on the previous course of the product life cycle (sales, cash flow, profit and growth rates) of the company’s own product or market areas is required, as well as the growth rates of the observed market. The company’s own relative market share can be estimated by comparing its own sales with total sales in the observed market.

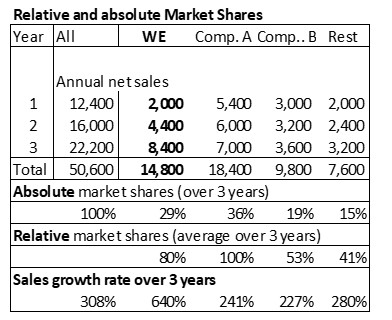
The table below shows the absolute and relative sales shares of the market participants in a product area. The data in the “We” column comes from the company’s own invoicing, while that of the main competitors A and B and the other suppliers (remainder) comes from publicly available information or estimates.

BCG-Matrix2
BCG-Matrix2

Compared to the largest provider A,”We” has a relative market share (average of 3 years) of 80% (14,800 / 18,400) and an absolute market share of 29% (14,800 / 50,600) compared to the total market.

Total market is growing strongly. In 3 years, sales increased from 12,400 to 50,600, i.e. by 308%. The company’s own growth rate is even higher at around 640%.

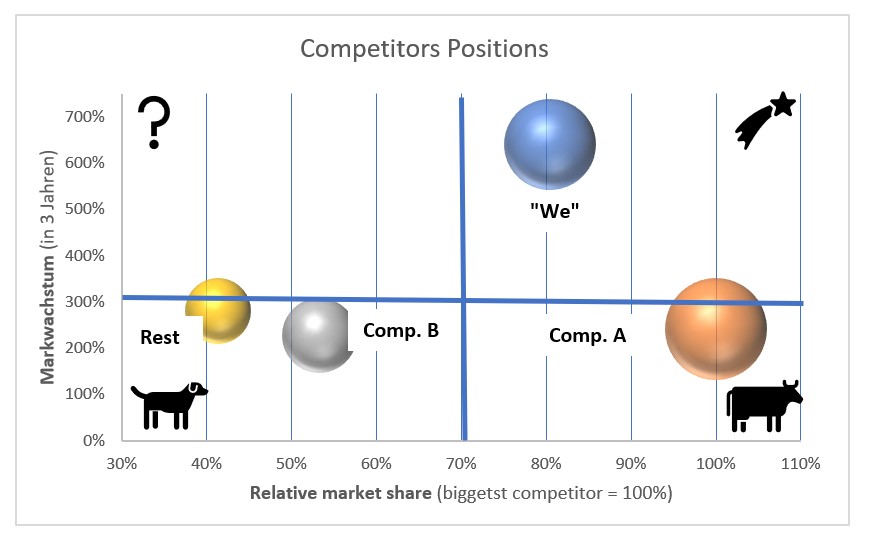
In the BCG matrix, the relative market shares are shown on the X-axis and the growth of the total market on the Y-axis. The size of the bubbles represents the sales volume of the individual providers. This allows to put the positions of the individual providers in relation to the sales leader and the competitors. For presentation the X- and Y-axes have been adjusted to the minimum and maximum values. Competitor A is (still) the sales leader. The sales of the other providers are positioned on the X-axis in relation to the market leader:

    • Competitor A is given the cash cow position because its sales growth is lower (247%) than that of the overall market (308%), but it still has the largest market share.
    • “WE” has caught up massively in terms of sales growth but is still in the “rising star” position. Sales are almost as high as those of competitor A. The reason for this is the strong sales growth of the last three years.
    • Competitor B’s three-year sales growth is slower than that of the other market players. As a result, its market position is slipping into the “poor dog area”.
    • The providers in the “Rest” group have grown slower than competitor A and “WE”. They do not seem to be able to provide potential customers with an offer that meets their needs. Their position has not improved in comparison to competitor A and “WE”. Because the “Rest” group is lagging behind in terms of sales development, it has slipped into the “Poor dogs” category.
Competitors Positions

As competitor A is already in the cash cow position, it must try to maintain sales for as long as possible, reduce or at least maintain the fixed costs of its own division and reduce proportional unit costs. This results in higher cash returns for the company, which can be used to build up new potential for success.

As long as “We” sales grow faster than those of the competitors, the business segment remains a rising star and should ensure that absolute contribution margins grow. These can be used to expand the company’s own market position or to finance new “question marks”.

“We” can use the cash released by this development to invest in question marks and to finance the growth of the stars.

Evaluating the Product Life Cycle

Evaluating the Product Life Cycle

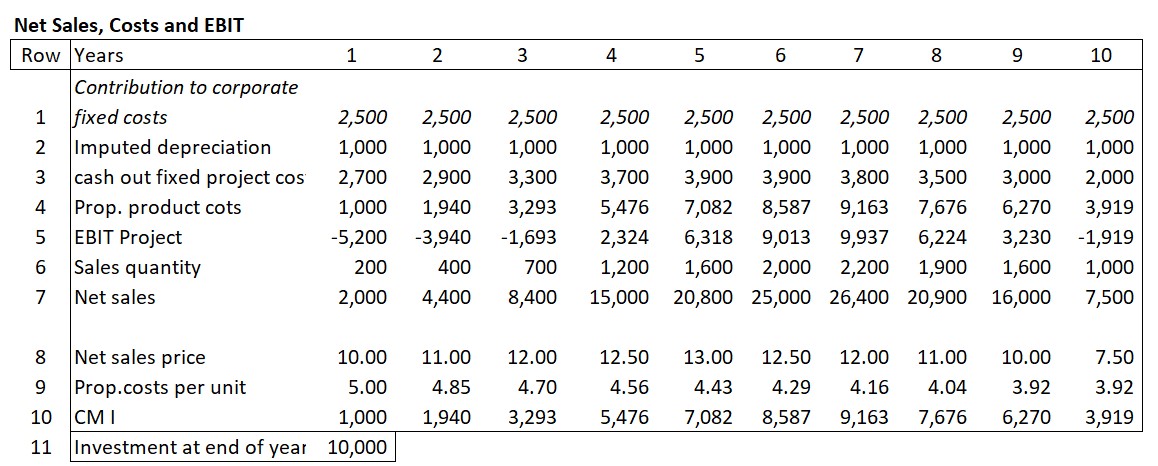
In an industrial company, the following development of sales, costs and net revenue has been observed over the course of a product life cycle:

    • Line 6 of the table contains the annual units sold. The net sales prices achieved can be found in line 8. The annual net sales achieved (after deduction of all sales deductions) were calculated in line 7. The proportional costs of the units sold can be found in line 4. The recalculations of the various years showed that process improvements led to a reduction in the proportional costs per unit of around 3% per year compared to the previous year.
    • The annual fixed project costs (cost centers) leading directly to cash outflows were summarized in line 3. The investment of 10,000 for the necessary new equipment (line 11) was amortized evenly over the 10 years of operation (1,000 p.a., line 2). The management of the company requested that the product contributes annually 2,500 to cover fixed company costs and EBIT (line 1).
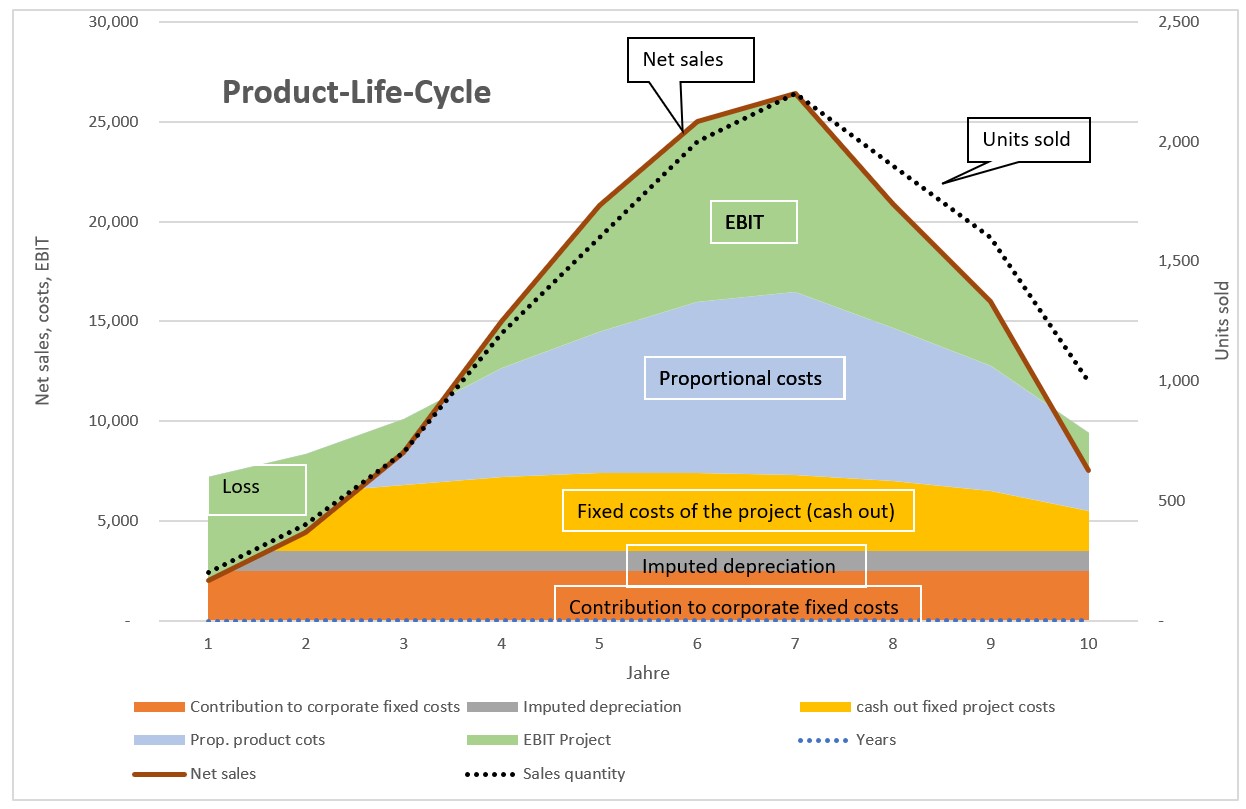
    • With this information line 5 shows the annual EBIT of the product. The order of lines 1 – 5 is chosen so that the fixed costs are at the bottom of the following chart and the net revenue is at the top.

Net Sales, Costs and EBIT

The chart visualizes the development over the years. This product generated losses in years 1 to 3 and 10.  However, the profits in years 4 to 9 were higher than the aforementioned losses. From year 7 onwards, sales quantities and realized net sales prices fell sharply. Despite lower sales prices in years 7 to 9, profits were still generated (see line 5), as care was also taken to reduce project-related fixed costs.

Evaluating the Producct Life Cycle

If this analysis is also prepared as a cash flow statement for the various years, it can be seen that the cumulative present value of the product life cycle only becomes positive towards the end of year 7 (line 4). The cash flows from sales at the end of the life cycle increased the present value of the strategy. This increase occurred despite lower net sales prices because the investments had already been paid for and as well the annual fixed and proportional product costs were reduced.

Due to the decline in sales beginning in year 8 accounts receivable and inventories also decreased, which led to high cash flows in years 8-9 despite the slump in sales (line 2).

Cash flows in the life cycle

Dynamic capital budgeting-calculation was used to determine the net present value of the life cycle.  This is particularly helpful to quantify strategic and medium-term operational plans (see the post “Dynamic Capital Budgeting“).

Countercurrent Principle

Planning and controlling from top to bottom or vice versa?

Countercurrent Principle

Anyone involved in the design of sustainable management systems automatically ends up with the question of whether to plan and control top-down or bottom-up. The answer is to proceed according to the countercurrent principle.

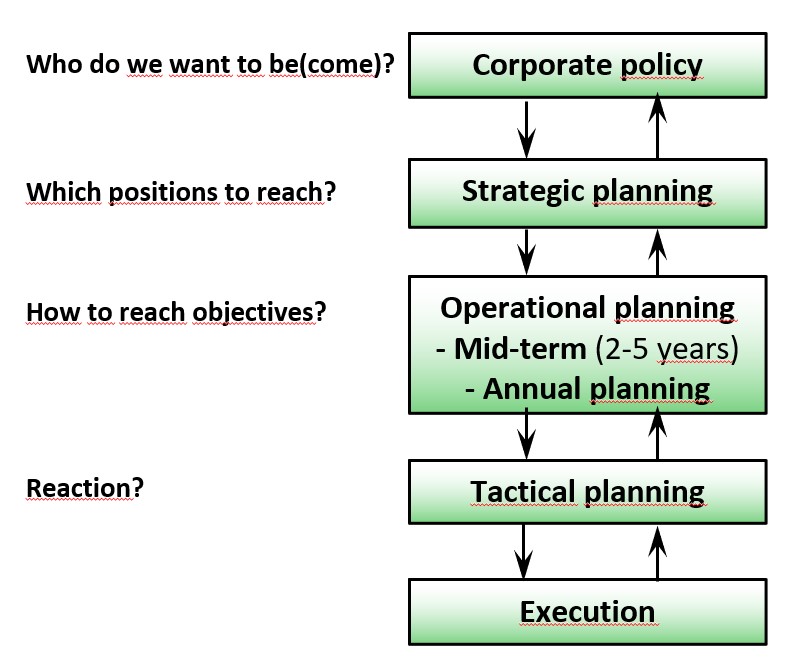
The post “The Main Questions of each Planning stage” shows that it is first necessary to answer what an organization wants to be or to become before implementation can be tackled. This determination is made by a small group of people, usually the owners. In corporate policy, they record their intentions regarding the markets to be served and the products or services to be provided for them. This is top-down leadership.

In strategic plans, the managers responsible for implementation specify which products and services they want to use to realize the corporate policy intentions in which markets (top-down). Before they can define the strategy, they have to make sure that the operating units of the company will be able to produce and sell the required products and services on time and in line with the market. To do this, they need feedback from the managers who will be responsible for implementation. The downstream managers assess from their operational perspective whether they have the personnel, factual, time and financial scope to implement the strategy operationally. This countercurrent assessment can lead to the adjustment of strategies. If this feedback is omitted or negated in decision making, there is a great risk that the strategies will cost more than they can deliver.

Countercurrent principle

In operational planning and control, the feedforward and feedback loop is repeated. The available personnel, the existing facilities and the current processes must be able to handle the projects required for strategy implementation in a proper and timely manner, to bring in the necessary sales at net sales revenues in line with objectives and to keep within the planned fixed costs.

Reporting must be bottom-up because actual data on sales, production, personnel development, project progress and the like are prerequisites for determining the target achievement of the objectives in a period under review.

These reports cannot be neglected in the next planning round if realistic objectives are to be agreed. The counterflow of data and assessments of real implementation thus forms the indispensable bottom-up input for agreeing on the next objectives.

Another argument in favor of applying the countercurrent principle is that in strategic management, other, usually more uncertain data from the environmental spheres (cf. the post “Environmental Changes are Crucial for Management Control”), are collected and evaluated more than in operational planning and control. In addition, the time horizons are different. In the upper part of the figure below, the focus is on the internal success potentials required for strategy implementation. In the lower part, an assessment is made of how successful the implementation was and how the development of future success potentials went. This assessment may lead to the need to adjust the objectives for the next periods.

Environment and countrcurrent principle
Considering the development of the environment in the countercurrent principle

Conclusion: Planning top-down is a prerequisite for determining an organization’s future potential and realizing it on schedule. However, operational results, bottlenecks in manufacturing, delays in research and development, and customer and supplier bottlenecks or a dried-up labor market can lead to changes in operational and strategic goals. Feedback loops must therefore be built into the planning process. Committed employees often contributed ideas that led to the realignment of a company.

Agile team management is based on the assumption that teams act on their own responsibility. However, this does not mean that they can change their mission without considering the higher-level objectives (see “Prerequisites for Agile Team Management“).

Improve Productivity

Improve Productivity

An organization becomes more productive if it succeeds in increasing its output while either keeping the input the same or, even better, reducing it. In the post “Profitability“, the measurement of productivity ratios was explained. These entail dividing output by the inputs consumed;the change in these ratios over time should be tracked. In the example of the mentioned post, a labor productivity increase of 11.11% was calculated by dividing the units sold (units of output) by the complete labor hours used by the company (hours of input). However, this ratio is of limited use for planning and controlling the company as it does not indicate which processes have become more productive and by how much. Productivity metrics are needed at the cost centers and process level as many sub-processes need to be continuously improved.

It is difficult to measure productivity development in smaller units, e.g. individual cost centers or processes. This is because improvements are to be achieved there first. In manufacturing it is possible to see whether processing times for a particular item in a cost center are decreasing over time by evaluating order-related activity recording. But to measure productivity improvements in internal processes and cost centers is tricky as often the output measure cannot be clearly delineated, because the activities of different cost centers contribute to the output and because their work effort is not (or cannot be) measured.

Example 1: Ticket answering in IT

Many data centers have set up ticket systems to process and respond to error messages or requests from system users. The output of such ticket systems is answered requests from system users. In order to measure output, it is necessary to define what is to be considered as a response and thus as an output (i.e. problem solved, systems running again or only the explanation of why the error occurred and how it can be avoided in the future).

The input measurement requires further determinations:

    • What work times to fix the error are to be measured? (The processing time of the assigned IT employee, of all parties involved, or even that for external support?)
    • Are the speed of response and the time to complete problem resolution also to be measured? If so, how are they weighted?
    • Are financial inputs also to be included, such as invoices from third parties, higher royalties, or depreciation? If so, the inputs must be equated, which can only be done using monetary values.

Example 2: Productivity in personnel administration

It is possible to determine whether the average number of hours required for the salary administration of an employee decreases over time: output = 1,000 salary receivers, input 30,000 hours p.a., i.e. 30 hours per person per annum. If an employee of the warehouse retires and is not replaced, 30 hours should be saved in the HR department per year. Only if in HR less than 29,970 hours are consumed has productivity of salary administration increased.

This means that the outputs and the inputs of the personnel department are to be differentiated, in order to gain deeper insight into the changes in productivity of their processes. How much working time is used for:

    • Recruiting and hiring employees
    • Recording and maintaining employee data including performance appraisal documentation
    • Payroll accounting, social insurances, settlements with third parties
    • Supervision of internal and external training and further education
    • Planning and execution of internal training events Coordination with works council and trade unions?

Example 3: Recording of sales order data and packaging for delivery

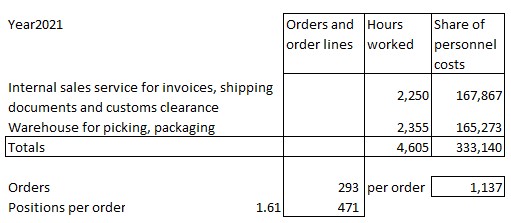
In the example company Ringbook Ltd. the productivity of sales order processing and of collecting and packaging the delivery for the customers should be increased. The costs of transporting the goods to the customer are not taken into account, since the delivery is carried out by external companies (post office, delivery service, transporting company) and invoiced to the customers according to the transportation price list. Only the personnel costs for these operations are considered. The analysis resulted in the following values:

Improve Productivity

In fiscal year 2021, 293 customer orders were processed with a total of 471 order positions. According to service recording (recording of hours used for internal tasks), see the post on internal tasks , 2,250 hours were worked in the sales department and 2,355 hours in the warehouse for the preparing and packaging of the positions sold. These hours were multiplied by the weighted hourly presence rate of the employees involved. This resulted in the personnel costs of the packaging, shipping and invoicing process of 333,140 EUR. On average, the processing of a sales order consumes 4,605 hours divided by 293 orders = 15.72 hours, resulting in personnel costs of 1,137 EUR.

The productivity of the invoicing and delivery process thus improves if the average personnel costs per sales order can be reduced below 1,173 EUR.

Measuring working times for internal tasks

The three examples show that productivity improvements must be sought and identified primarily in the individual cost centers and in cross-cost center processes. To this end, time consumption for processes must be measured first and foremost, which is particularly difficult in areas not directly related to production.

It is necessary to be able to conclusively identify the contents and results encompassed by a process. Additionally the recording of activities must be structured in such a way that the work performed can be recorded according to these delimitations and that linked work steps of other cost centers can also be recorded, e.g., the working time of the production data management in order to be able to trigger and track a production order.

To evaluate ideas for productivity improvement, it is necessary to be able to measure or at least estimate consumption, especially of employee hours. With this in mind, planning and recording consumption for internal tasks will be covered in more depth later in this blog.

Investments for productivity increases

When looking for productivity improvements, often the question arises as to whether individual tasks should be outsourced to another company or whether investments in hardware, software or automation might be worthwhile. In such cases, Dynamic Capital Budgeting proves to be an effective means of quantifying process-related changes. This is because it can also include investments and changes in consumption of material and worktime. Cost savings are compared with the investment amounts and the expenditures for external services, and their effects are quantified for the planned useful life of the project.

More details in the post “Dynamic Capital Budgeting”  (will be published Jan.3rd 2023)

Function diagram

Function diagram

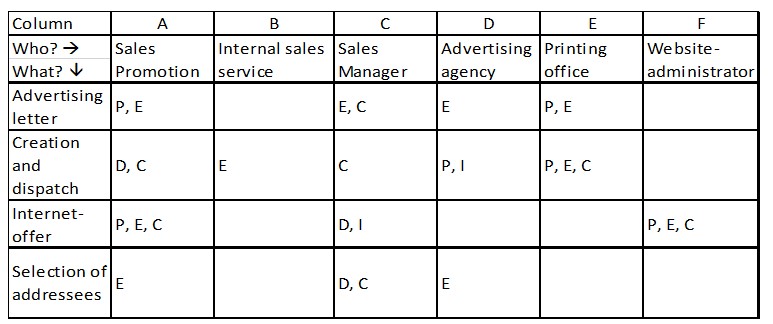
In its conventional form, the function diagram compares a group of tasks of an organization (vertical column) with the contributions that the persons or areas involved are to make to the fulfillment of these tasks (horizontal column). In the fields of this two-dimensional representation, the contribution to be made is indicated by a letter. The letters “PDECI” can be used to enter the contributions of individual persons or departments:

P plan

D decide (on the implementation of the plan and the quality of the result)

E execute

C check (what result has been achieved?)

I inform (who receives news about what has been achieved?)

A function diagram thus replaces a lot of text that usually has to be entered and maintained in job descriptions. On one hand, this saves recording and maintenance effort in personnel administration, and on the other hand, it is possible to see in one line for each task who makes which contribution to it.

Function diagram
Function diagram

The tabular presentation can be expanded in many ways. Contributions from external companies and their employees can also be listed (columns D and E), deadlines and brief descriptions of the tasks can be attached. Likewise, the working time consumption to be planned for each individual task can be entered.

The strategic planning process can be supported with the function diagram as well. The intermediate results necessary for strategy determination and even more for strategy implementation can be described, assigned to individual persons or areas involved in the process and detailed. The (intermediate) results achieved can be documented. In additional columns planned and actual deadlines can be recorded for each task and it makes sense to also record the working hours used for this (planned and actual).

Planning and Control of Internal tasks

For products and services that can be sold or stored, the planned and actual working times are usually stored in the product-routings in the ERP-system, since they are to be linked to management accounting. The ERP also describes how the manufacturing process is to be handled.

However, this activity-related connection does not exist for the Internal tasks, since there is no direct cause-effect relationship between quantities produced or sold and time consumed for tasks such as cost center management or for handling a purchase process. To be precise we mark Internal tasks with a capital “I” because they include all work performed in cost centers that is neither directly caused by the manufactured and sold products nor requested by other cost centers according to their free will (see glossary).

It therefore makes sense to expand the function diagram into a veritable database that can be used by all employees and their bosses for planning and measuring their work. From a management point of view, a corresponding application should be able to collect and evaluate the following data:

    • Internal tasks (catalog)
    • Subtasks of an Internal task
    • Planned demand in hours p.a. per Internal task
    • Cost centers (where work is done, functional area assignment)
    • Contribution types (PDECI) of those involved in an internal task
    • Time requirement plan (recorded by cost center manager or employees)
    • Employees (who is working on the task, personnel costs?
    • Work performed with time and date (personal worktime recording)
    • Plan to actual comparison of work done
    • Service recipient (customer, cost center, project)

To use these data for planning and control, different files, which are already kept in many companies, have to be connected by a data model and a corresponding application.

Comparing planned to actual time consumption, planning for the next few years can be improved and costs of individual tasks can be calculated by reverting to payroll administration data.

The columns can be extended down to the level of the individual employee. Additional columns can be used to record deadlines per task and quantify the costs of these tasks.

In a large number of companies the execution of Internal tasks already consumes more than 50% of the total personnel costs. But in our experience this cost block is rarely planned and controlled in a results-based manner. Function diagrams for Internal tasks can help to ensure that their grow less than proportionally compared to the development of sales and contribution margins. This increases competitiveness.

Environmental Changes are Crucial

Presumed developments in the sub-environments are to be well structured for holistic planning and control.

Presumed Environmental Changes are Crucial for Management Control

Every organization is constantly exchanging with its environment. “Out there” are the customers, potential employees, suppliers, financers, the state and other public institutions with their specifications and laws, as well as the social groups with their changing perceptions. All this is embedded in the natural environment.

Environmental Changes are Crucial for Management Control
Sub-environments and AMPLE control

How can environmental factors be structured in such a way that management can relate them directly to its strategic and operational decisions? We use structuring in partial environments (taken from Hans Ulrich, p. 31). Four sub-environments are distinguished:

Natural environment:

This includes everything that happens on earth, including that which is caused by extraterrestrial influences. Although humans can disturb the development of the natural environment, they cannot directly influence it for the good.

Social environment:

Everything that is shaped by behavior, rules and interaction between people. This also includes developments and specifications of governmental and international organizations, changes in interpersonal rules of conduct, changes in mentality and changes in social interaction.

Technological environment:

Changes in sales and procurement markets, new technologies and application areas, and changes in potential competitors.

Economic environment:

Whoever provides financial resources to build or operate organizations wants to be compensated for sacrifycing other investments or consumption. He considers whether his use of funds will be remunerated in line with market conditions. To do this, he weighs the security of the cash or value return against the interest that can be realized with other investments. This in turn depends on the possible compensation of alternative investments and the risk to be taken.

Example topics in the sub-environments

When establishing or expanding a business, opportunities and risks must be identified and weighed up. For this purpose, they must be documented and assessed.

The management control system is the appropriate place to record this documentation and the resulting findings for the management bodies. The four environmental dimensions help to structure, sort and weight the planning statements. They also help to consider all environmental variables when defining the development lines. Examples include:

    • What influencing factors from the natural environment could make it necessary to adapt our business model? Which elements could make success impossible or, on the contrary spur it on?
    • To what extent do other structures of living together (e.g., patchwork families, work-life balance, less full-time employment) affect our applied management processes as well as the availability of our employees? Will the increasing density of legal regulations generate higher personnel requirements or even make the profitable continuation of our current business impossible?
    • Are new application technologies, raw materials and manufacturing processes emerging that will open up new sales opportunities for our products and services? Are there any recognizable saturation or substitution tendencies in the market that could render our existing offerings obsolete? Do new technological standards, e.g., operating systems of computers, require an adaptation of our own products and services?
    • Are there any developments to be suspected in the customer acquisition process that could jeopardize our sales success to date or are sales intermediaries conceivable who could help to make our products and services better known? Can the concentration of suppliers in saturated markets endanger our existence? Are our competitors theoretically able to produce their products more cost-effectively than we are?
    • What profitability is to be achieved so that existing equity and debt capital providers continue to invest in our business and – if necessary – new investors can be attracted? What is the degree of self-financing needed to be able to make independent decisions even in periods of low profit and to prevent loan terminations?

In the establishment of corporate policy and strategies a link to environmental developments must be created. In our experience, it is helpful to structure the decisions to be made according to the four sub-environments mentioned.
For a more in-depth consideration of the corporate environments, see section 1.1 in the book “Management Control System” (https://management-control.eu/store).

Management Control System Definition

A Management Control System is developed for all managers, irrespective of their hierarchical position. Its purpose is to support decision making and comparison of actuals to plan.

Management Control System Definition

A management control system helps all managers to plan and control in an integrated way. This improves company-wide coordination and the achievement of objectives.
It comprises the following subsystems:

Management Accounting + Piloting + Early Warning

Early Warning:
Early warning is intended to recognize and structure opportunities and threats in the various corporate environments and, as far as possible, make them measurable. In particular, it is necessary to find out which company-related early warning indicators from the environments can describe significant developments that provide relevant input for strategic and operational planning (opportunities and risks for the future of the company).

Pilot control:
To seize opportunities requires the planning company to build up and maintain the necessary success potentials. Strengths can arise from special skills and abilities of the personnel, large management capacity, suitable knowledge for market cultivation, new products and services, advantages through comprehensive process integration or particularly suitable manufacturing facilities. Weaknesses can possibly prevent the translation of opportunities into operational success.

Internal strengths can usually only be built up (or possibly purchased) over a period of several years. For the preparation of operational plans and budgets, parameters are to be found that can measure desired developments in a forward-looking way. Here are some examples: Development of management capacity (number of potential managers in relation to existing ones), development of adherence to deadlines in projects and in delivery readiness, progress in new customer acquisition per time unit.

Insofar as weaknesses in an organization are the result of factual or technical knowledge and application gaps, they can often be mitigated by training and further education or by hiring suitable people. Weaknesses that are rooted in the individual person can hardly be eliminated, especially when employees produce very good results as long as they can work on their own but do not feel comfortable in teams.

In contrast to early warning data, parameters for assessing the development of success potentials (development and expansion of future strengths and reduction of existing weaknesses) are mainly obtained from internal company data. Because the data used for this purpose serves as the basis for medium-term planning, it must be available before the actual operational planning. They are the internal input for planning decisions. This is why we call them piloting factors.

Accounting for management:

In the operational area (medium-term and annual planning as well as tactics (disposition)), plans are more finely detailed and the associated objectives are defined and hopefully also implemented. Accounting for Management is intended to enable managers at all hierarchical levels to translate their plans into objectives for the actual activities and to prepare the target to actual comparisons.

Target to actual comparison is intended to find starting points that will lead to the definitive achievement of objectives in the coming periods (e.g., months). It is created in monetary values so that different consumptions and services can be compared with each other.

This requires a consistently management-oriented cost, performance, revenue and contribution accounting up to Earnings Before Interest and Taxes (EBIT). It must be able to map plan, target, actual and forecast. The data foundation comes from the tactical systems (Enterprise Resource Planning Systems (ERP)) and from ledger accounting.

Management Control System Definition

Definition of Management Control

Management Control is the process to insure that strategic intentions are realized.

Management Control is the process by which managers at all hierarchical levels ensure that their strategic intentions are realized (see the definitions of R. Simons (in “Levers of Control”) and R. Anthony/V. Govindarajan (in “Management Control”).

To carry out this process requires basics such as the formulation of corporate policies and organizational strategies, as well as instruments that help plan and measure their implementation and enable coordination between the subsystems of an organization.

Managers guide their subordinates in implementing strategies based on their personal objectives and performance measures. Various planning and control instruments are required to achieve this. We refer to all of these as management control systems.