Strategy Development

Strategy Development

In corporate management the term strategy is used for many different things. As a result, different approaches are recommended for developing a strategy.

Here the aim is to structure and execute the process of strategy development in such a way that plans for the medium-term development of a product/market combination are created and that the implementation results achieved can be assessed qualitatively and quantitatively. This is based on the definitions in the post “Strategy and Functional Concepts“. In particular, the definition of a unique selling proposition (USP) according to Michael Porter is quoted there.

Most of our clients want to increase their market share with a strategy in order to achieve higher earnings before interest and taxes (EBIT).

This searching and fixing process cannot proceed in a straight line from the identification of objectives to the assessment of results because the results to be achieved are not yet fixed at the beginning. External and internal information must first be obtained, often only insufficient data is available and various internal participants in the process with different levels of knowledge and intentions have a say. This requires a multi-phase approach to processing questions and many feedback loops. Additionally, the composition of the processing team often changes during the discovery process.

In the process of developing and adapting strategies, the following questions usually need to be answered:

    1. Which product/market combination do we want to strengthen? (Strategic idea)
    2. How do we stand out from the competition (USP, from the customer’s point of view)?
    3. Who are our competitors, what turnover/market share do they achieve?
    4. Which services/products do we not have to achieve our goals?
    5. What internal developments are the prerequisites for success, or what knowledge and skills need to be acquired?
    6. How much investment will be required?
    7. Which employees do we lack
    8. What critical premises are contained in the above points that could prevent a successful strategy realization in the target markets? Examples: New legal regulations, political shifts, changes in consumer behavior, successes of competitors.

Points 1 – 3 are externally oriented, i.e. changes in the corporate environment must be observed and assessed. They can lead to the adjustment of strategic goals and plans

The status of points 4 – 7 must be determined within the company. The necessary developments must be derived from this.

If events occur during the implementation process that affect the critical premises (point 8), it must be analyzed whether the current strategic plan (points 1 – 3) needs to be adjusted or whether adjustments need to be made to points 4 – 7.

This requires regularly feedback throughout the process of strategy development and after the interim results have been established. They must lead to a decision as to whether the strategy implementation should be continued (go) or discontinued (no go).

From the strategy draft to the implementation project

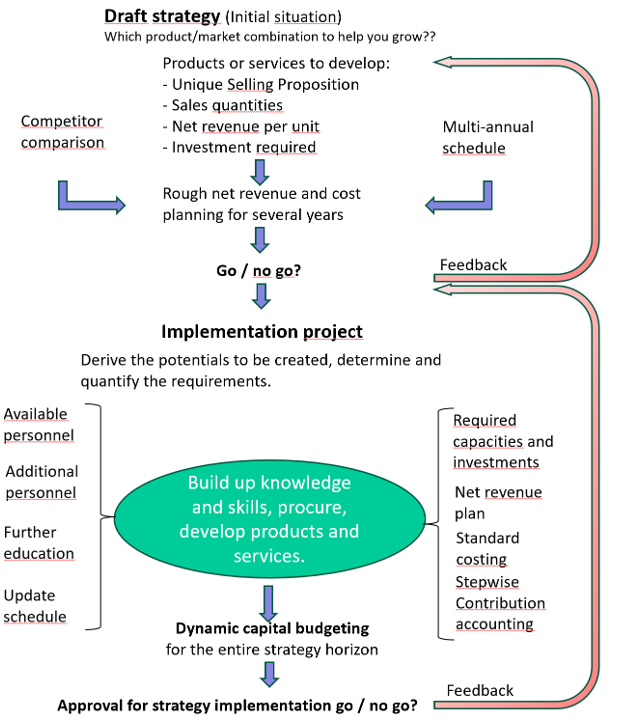
The flow chart below shows the path from the strategy draft (creative act) to the release of a strategic plan.

It starts with an idea of which products the company should use to gain market share in which (sub)markets in order to improve its own market position and profitability. The time horizon is usually several years and the behavior of the competition can prevent success. It is important to estimate the financial impact of the strategic idea as reliably as possible before investing time and money in the further development of the idea.
Strategy Development

To tackle a promising strategy implementation project, it is advisable to estimate the achievable net revenue and follow-up costs of the strategic idea for the envisaged strategy horizon. These assumptions should be included in the strategy draft because they form the basis for the first go/no go-decision, namely whether the strategic project should be approved for development at all. It only makes sense to continue the project work if it is a “go”. The description of the unique selling proposition is also essential for this. This is because the decision-makers want to be able to recognize whether the strategy can create a USP before they place the order for the actual implementation project.

SWOT-Analysis

SWOT-Analysis

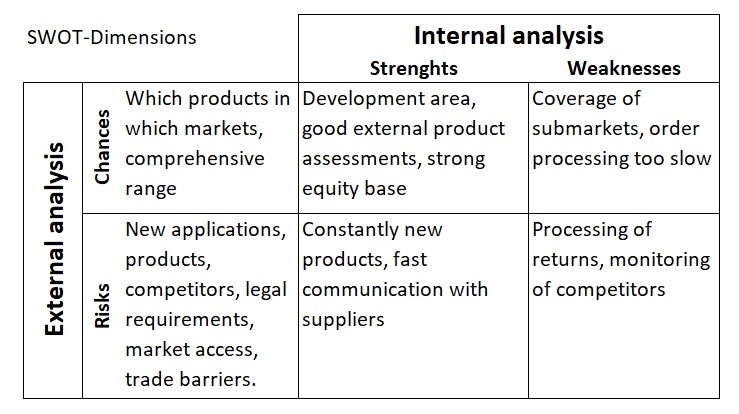
A SWOT-Analysis is intended to produce a structured presentation of the strengths and weaknesses of the organization under consideration and to compare these with the opportunities and risks in the four environmental spheres (see the post “Environmental Changes are Crucial“).

The purpose of the opportunities/risks and strengths/weaknesses assessment is to

    • create the basis for strategic planning and
    • define the potentials for success required for its realization.

The SWOT-analysis is primarily prepared by the top managers of an organization. They determine the direction in which the company/organization should develop and assess whether the targeted development will be feasible in the medium-term time horizon. The decisions derived from the SWOT-analysis form the template for the strategic and operational planning managers.

The subordinate management levels should derive with which services and products the company will achieve strong positions in which markets and which results should be achieved (corporate policy definitions).

The assessment and documentation of external opportunities and threats and the evaluation of the company’s own strengths and weaknesses form the input for strategic and medium-term planning.

Analysis of the environment and the company’s own position

The widely known SWOT-matrix shows the initial questions for the analysis:

Company environment: in which environmental areas opportunities for new products and services are presumed and which threats could prevent success?

Assumptions for the own development: In which product/market combinations does the company see its strengths for expanding its market position, and which of its own weaknesses could hinder success?

SWOT-Analysis
SWOT-Analysis

The above questions on opportunities and risks are examples. This also applies to the assessment of the strengths and weaknesses of your own company.

If a company’s management prepares its own SWOT-analysis and records its findings in the matrix, the subsequent management levels can align their strategic plans and, above all, the development of future potentials for success accordingly.

How strategic and medium-term plans are derived from the SWOT-analysis for the company as a whole is the subject of the following posts:

BCG-Matrix and the Life Cycle

BCG-matrix and the life cycle

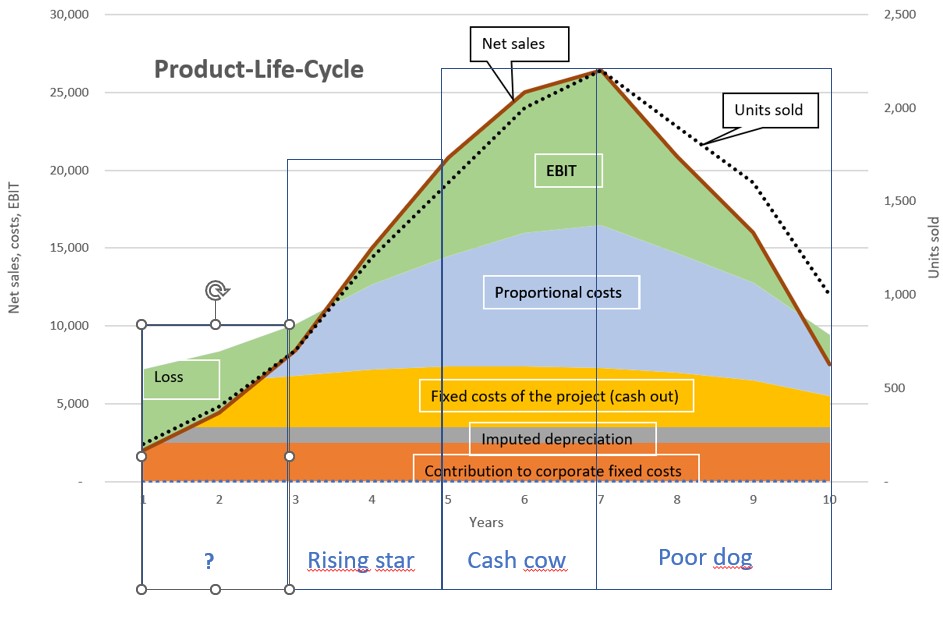
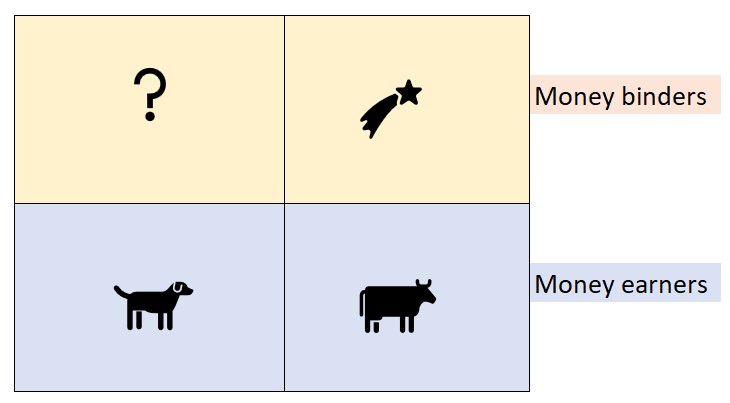
The four phases of a product or market according to the BCG-matrix can usually also be recognized in the life cycle of a product:

    • If a company achieves initial sales and turnover success with a new product or a new product group, it is not yet clear whether it will become a success. It is still a question mark.
    • If sales volumes and turnover increase more strongly than in the previous year (the curve is always steeper), this is a rising star. It is possible that not all costs are covered at the beginning of this phase, but the contribution margins are growing faster than the fixed costs. The product enters the profit phase.
    • The cash cow phase begins when the annual sales growth rates decrease compared to the previous year. Profits reach the highest absolute values, which also increases liquidity. Owners can be paid higher dividends or new question marks and stars can be financed.
    • The start of the downturn phase (poor dog) cannot be precisely defined. If the competition also records lower sales volumes, the downturn is probably already underway. In such a situation, it is important to know whether contribution margins are still being generated to cover the fixed costs of the product or sales area. If the contribution margins are tending towards zero, the product must be removed from the range as it no longer contributes financially to the company’s success.
    • BCG-Matrix in the life cycle
      BCG-Matrix in the life cycle

Effects on financial solvency

The BCG matrix also provides an important insight into a company’s liquidity:

Question marks and stars tie up liquidity (available cash) because

    • more sales lead to higher accounts receivable,
    • higher inventories are required for timely delivery,
    • investments in fixed assets have to be paid for.

Cash cows and poor dogs free up liquidity because

    • there are hardly any new investments to be paid for in the business area,
    • due to falling sales, accounts receivable balances also become less,
    • less inventory needs to be financed in order to fulfill orders on time.
BCG-Matrix
BCG-Matrix (Money binders and money makers)

The combined use of the BCG-matrix and of the dynamic investment calculation is particularly recommended for strategic and medium-term operational planning. The focus is on the profitability of the targeted product/market positions. However, it is also to clarify whether the projects can be financed from the company’s own funds or whether external liquid funds will have to be procured.

SWOT Analysis

SWOT Analysis

SWOT analysis is intended to produce a structured representation of the strengths and weaknesses of the organization under consideration and to contrast these with the opportunities and threats in the four environmental spheres (cf. the post “Environmental Changes are Crucial for Management Control“).

The purpose of the opportunities/risks and strengths/weaknesses assessment is to,

    • create the basis for strategic planning and
    • define the success potentials necessary for their realization.

A SWOT analysis is primarily prepared by the top management of an organization. They determine whereto the company / organization should develop and assess whether the targeted development will be feasible in the medium-term time horizon. The decisions derived from a SWOT analysis form the planning template for the strategic and operational planning executives.

Subordinate management levels should be able to derive which services and products the company should use to achieve strong positions in nominated markets and which results should be achieved in the process (corporate policy determinations).

The assessment and documentation of external opportunities and risks and the evaluation of the company’s own strengths and weaknesses form the input for strategic and medium-term planning.

Analysis of the environment and of the own position

The widely known SWOT matrix shows the initial questions of the analysis:

Business environment: In which environmental areas are opportunities for new products and services suspected and which threats could prevent success?

Own development direction: In which product/market combinations does the company see its strengths for expanding its market position, and which of its own weaknesses could prevent success?

SWOT Analysis
SWOT Analysis

The above questions on opportunities and risks are examples. The same applies to the assessments of the strengths and weaknesses of the own company.

If a company’s management creates its own SWOT analysis and records its findings in the matrix, the subsequent management levels can align their strategic plans and, above all, the development of future success potentials accordingly.

How the strategic and medium-term plans for the entire company are derived from the SWOT analysis is the subject of the following posts:

Internal Tasks

Internal Tasks

The term “Internal Tasks” stands for all work to be performed in a company that is not directly caused by the units produced or by the activity of the receiving cost center. Internal tasks are only indirectly related to the products and services produced or sold. For better distinction we always write the term in our blogs with a capital “I”.

Examples of Internal tasks:

    • Management, planning and control work in all areas
    • Work of all sales-oriented cost centers
    • The entire production planning and control as well as work preparation
    • Work of personnel administration, payroll accounting and the time spent on training and further education
    • Work of procurement, warehousing, forwarding
    • Development and operation of the entire information technology as far as its services are not directly caused by orders from individual cost centers or customers.
    • Work to keep buildings, company premises, installations and machines ready for operation
    • Administrative work to comply with legal requirements.

All these Internal tasks have in common that they are rendered to keep the whole organization ready to perform. How much work capacity is built up and provided by employees or plant capacity is decided by managers as part of strategic and operational planning.

Planning hourly requirements for internal tasks

More than 50% of total personnel costs are incurred for Internal tasks in many industrial and service companies today. Therefore, the annual hourly requirements for these tasks must be planned and recorded in each cost center.

The difficulty lies in creating reliable capacity requirement plans for all Internal tasks. On the one hand, this is due to the fact that people in these areas perform a wide variety of tasks more or less in parallel. On the other hand, only a few companies record time consumption for Internal tasks. This makes it difficult to plan requirements.

To get a better grip on capacities and the cost block for Internal tasks, we recommend since years that the worked hours for Internal tasks should also be recorded by types of work. The presence time of a person can be measured quite easily using time recording devices but many managers are not even required to perform this recording for themselves.  But just from recording the presence time it is not possible to evaluate for which task type how much time was spent.

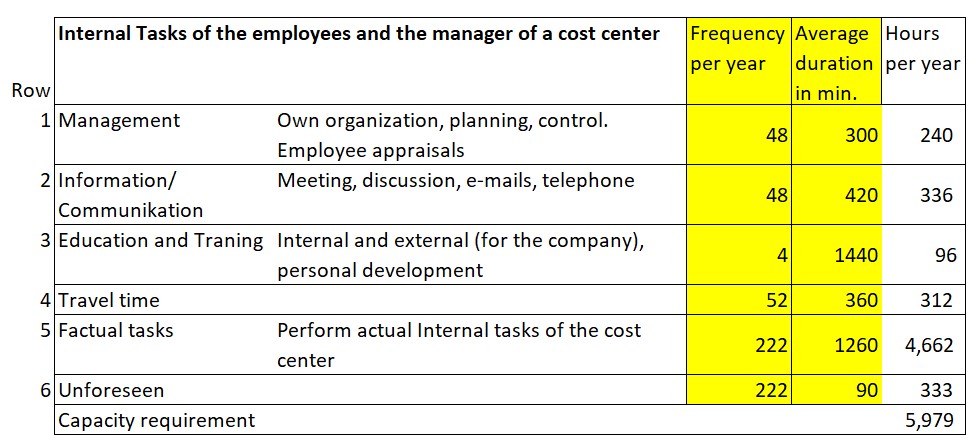
We made the experience that already the planning of the task types in the internal areas generates important insights for capacity planning. For this purpose, the Internal tasks are divided into six groups, which occur in almost every cost center:

Internal Tasks
Capacity requirements for Internal Tasks

For the factual tasks (Row 5) subgroups can be created in individual cost centers as needed. In the sales-related functions for example:

    • Addressing potential customers
    • Support of existing customers, preparation of offers
    • Capacity requirement for contract negotiation.

In the human resources department subgroups could be:

    • Recruitment and selection of personnel, payroll and social security
    • personnel and sickness care
    • Documentation of the potentials of managerial and professional staff.

Planning at this level of detail brings benefits to the whole company. Since employees are usually reluctant to record the time spent for different Internal tasks, a user-friendly and thus largely automated recording application must be set up.

Thanks to the lean production movement impressive improvements were already achieved in the area of directly product-related services and production management. Now it is time to apply the findings to Lean Administration as well (see the corresponding posts in the Lean Management area of this blog).

Managing inflation internally

Managing inflation internally

A company can rarely pass on supplier price increases in full to its customers. Managing inflation internally is a must. This is because the company’s existing customers will, in their own interest, try to buy cheaper from other suppliers, consume less, use other input materials or even withdraw their own offerings from the market, because they are no longer profitable due to price increases. Potential new customers will also compare offered prices and services and order where they feel they get the most for their money.

A bidding company must therefore maintain its own profitability despite inflation so that it can continue to invest in its own future. Professor Simon calls this profit defense (p. 56 in the book Beating Inflation). In terms of planning and control, profit “should be included in the calculation from the outset like a cost variable to be covered (ibid., p. 52).” This requires the continuous increase of effectiveness and efficiency of one’s own actions. (Definitions in the glossary)

Effectivity = doing the right things

Efficiency = doing the right things right.

Therefore, all cost centers must find, decide on and implement measures that are suitable for achieving profitability in line with the market (see “Profit in Line with the Market “).

Cost reduction measures for functional areas

The ROI-tree from the post “ROI and Inflation” helps to generate ideas to increase profits, to evaluate these ideas from a financial point of view and finally to measure their implementation success. Exemplary starting points are structured below according to functional areas:

Managing Inflation internally

Sales, prices, conditions:

    • Announce and justify price increases quickly, even if customers temporarily switch to competitors (get ahead of the “cost wave” with price adjustments).
    • Increase prices in several steps to discourage customers from switching.
    • Do not give discounts at the time of ordering but pay refunds when a predetermined purchase volume is reached (sales model).
    • Fix terms of payment without cash discounts and accelerate the dunning process in parallel (cash discounts directly reduce profits).
    • Develop new pricing models, e.g. pay per use or pay per period (applies especially to products or services with low proportional manufacturing costs).
    • If the product or service is superior to competing offers, customers will buy at even higher prices.

Marketing, sales, distribution:

    • Care for existing customers according to ABC-analysis (A and B customers generate higher absolute contributions and should consequently be looked after more intensively).
    • Continuous procurement of new leads (addresses of potential new customers) and prompt contacting.
    • Largely digital customer engagement to reduce customer visits (less travel).
    • Analysis of contribution margin development after trade shows and exhibitions.
    • Fix advertising contributions to reselling customers as a share of your contribution margin and grant them only after the sales have been achieved.
    • Free delivery of a part of the order quantity often reduces the customer contribution margin less than direct discount percentages from the sales price, because only the proportional costs reduce the contribution margin.
    • Continuous monitoring of competitors’ prices, assortments and sales development to locate opportunities for new offers.
    • Completely automated dunning system to reduce days sales outstanding.

Manufacturing processes / production planning and control:

    • Larger production batches reduce proportional manufacturing costs per unit, as setup times are incurred only once per batch. It is worthwhile to regularly reconcile order intake with inventory levels and the size of production orders.
    • Train employees to master several processes and thus have less idle time.
    • Automate process steps. In times of inflation, it is often easier to obtain funds for investment, albeit at higher interest rates.
    • Continuously check whether suppliers offer certain semi-finished products cheaper than you can produce them yourself (in- or outsourcing based on proportional manufacturing costs plus direct fixed costs of your own process).
    • Introduce computer-controlled processing steps and thus reduce manpower requirements.
    • Digitalization of planning and control of production orders as well as production data acquisition.
    • Reduce scrap.

Purchasing and inventory:

    • Consumption scheduling per purchased item based on planned consumption of production and sales in order to achieve more favorable framework-agreements with suppliers.
    • Regular comparisons of purchase prices of potential suppliers. Have a substitute supplier ready for each procurement item.
    • Immediate information of the sales department and other affected cost centers in case of imminent price changes of important articles or services to be procured.
    • Report purchase price variances from budgeted purchase prices on a monthly basis to estimate the impact on product and services to be sold in subsequent stages.

Research and development: 

    • Find cheaper or more suitable input materials.
    • Reduce process turnaround time for customer-specific developments as quick responses build customer confidence.
    • Regular assessment of project progress with go/no go decision ends stagnant projects earlier and frees up research capacity.

Internal service areas:

    • Continually re-evaluate out- or insourcing (what do we maintain and repair ourselves, what do we outsource?).
    • Outsource maintenance and cleaning and reduce cadence if they are not a prerequisite for operational readiness (make fixed costs more controllable).
    • Do not charge fixed costs to recipients in internal activity allocation. The service provider is responsible for its own fixed costs.

Controller:

    • Fast execution of the planning process and prompt internal reporting are becoming increasingly important because inflation affects the procurement side quicker than the receipt of payments.
    • At low value added, cost management is concentrated on the purchasing side because purchase prices change quickly and strongly. At high value added, the focus is primarily on personnel costs. Inflation tends to lead to job cuts.
    • Introduce cost splitting into proportional and fixed costs both in planning and in target to actual comparisons.
    • Enable computer simulation of cost and revenue developments so that changes in volumes, prices and costs can be estimated in advance.
    • Apply dynamic investment calculations so that the effect of inflation on present values becomes apparent.

Management processes:

    • Determine responsibilities of individual management positions so that adherence to qualities, quantities, deadlines, and results can be determined.
    • Introduce company-wide Management by Objectives and regularly measure and assess the achievement of objectives by individual employees.
    • Introduce shop floor data collection also in administrative areas to continuously reduce time consumption in these areas.

Fighting inflation internally is the task of managers at all levels of the hierarchy. If they do not manage to make the total value-added costs grow slower than net revenues, the company will lack the profits to invest in the future and will disappear from the market over time.

ROI and Inflation

ROI and Inflation

The ratio Return On Investment ROI is defined as:

Profit before deduction of taxes and interest (EBIT) : invested assets.

EBIT (100) / Balance sheet total (1,000) = ROI (10%)

The financing structure, i.e. the shares of debt and equity on the balance sheet total, is therefore not taken into account. This enables the profitability comparison between different companies even if they have different financing structures.

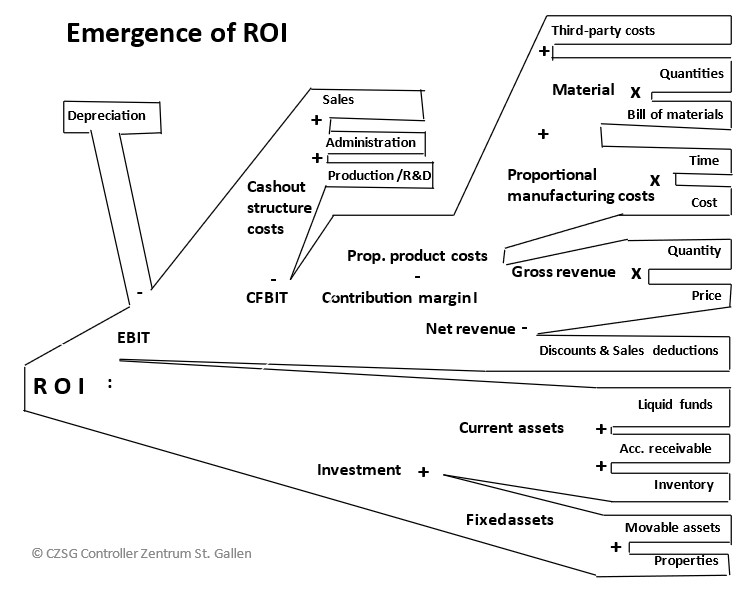
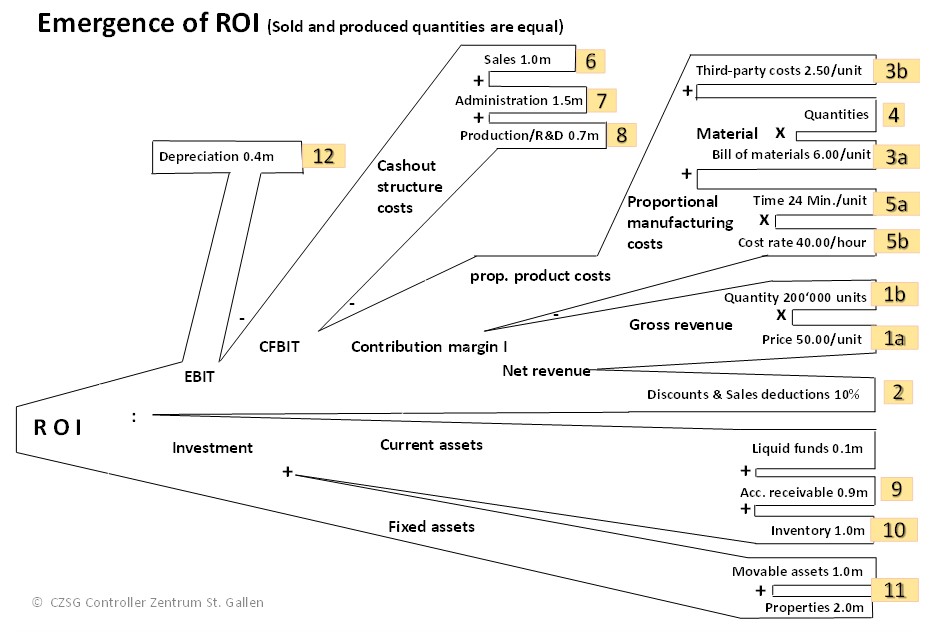
If the revenue and cost sides of a company are broken down into their main components, it is possible to see which items affect ROI and to what extent. We call this representation the “ROI tree”.

ROI and Inflation
ROI and Inflation

In the example, 200,000 units were sold at a gross price of 50.- per unit. This corresponded to the gross revenue of 10.0 million. 10% discounts and other sales deductions were deducted from this, resulting in net revenue of 9.0 million (1a, 1b, 2).

The direct material and unit-related external service costs amounted to 8.50 per unit (3a, 3b, 4). Manufacturing consumed 24 minutes per piece, which at the rate of 40.00 per hour resulted in a proportional manufacturing cost of 16.00 per piece. Multiplied by the production quantity of 200,000 pieces, the proportional production costs were 4.9 million (5a,5b).

This resulted in a contribution margin I (CM I) of 4.1 million.

CM I was used to cover the fixed cost center costs of the functional areas (6, 7, 8), which resulted in a cash flow before deduction of interest and taxes of 0.9 million.  After deducting imputed depreciation and amortization of 0.4 million, the profit before interest and taxes (EBIT) was 0.5 million.

Dividing the EBIT of 0.5 million by the assets invested in the period of 5.0 million (9, 10, 11) gives the ROI of 10% in the year under review.

Effects of inflation

    • If the suppliers of materials and external services increase prices by 5%, this results in a cost increase of 0.085 million for the company. The graph shows that this amount has a direct impact on EBIT and thus also on ROI. See also the post “Purchase Price Variances are topical again”).
    • In the same way, price increases for auxiliary materials and purchased services have an impact on the cost centers. This affects the production centers (5a, 5b) as well as the cost centers of the other functional areas (6, 7, 8).
    • If machines, buildings, equipment and intangible goods become more expensive, the imputed depreciation increases as a consequence, which again lowers EBIT and thus ROI (12).
    • Another consequence of inflation is that employees lose purchasing power. They will demand – somewhat delayed – higher wages (5b, 6, 7, 8).
    • On the left side of the balance sheet, inflation also leads to higher invested assets.
    • If inventory levels remain the same, the average value of the stock will rise (10).

Banks will raise interest rates on loans, which will reduce pre-tax profits. In the end, business owners (partners, shareholders) will also demand higher dividends because the purchasing power of their dividend income will also decrease.

Conclusion: Inflation is a vicious circle that must be broken by all means. In the private sphere, renunciation must be practiced in order to cope with disposable income and assets. In the corporate sector, attempts must be made to push through price increases. In doing so, there is always the risk that customers will jump to other suppliers, resulting in a drop in sales. Even more important is to strive to improve efficiency in all areas, i.e. to break the vicious circle through more cost-effective processes and structures.

Starting points for improving efficiency are the subject of the next post.

Beating Inflation

Beating Inflation

Beating Inflation” is the title of the book by Prof. Dr. Hermann Simon, the “old master” in price management and profit control, published in 2022. This publication deals with the demands that the currently again rampant inflation places on corporate management. Many of his statements are also essential inputs for the design of a comprehensive management control system and thus for the sustainable success of a company. In this and in the next two posts of this blog, his insights will be combined with the design of the comprehensive planning and control system of a company.

After a period of about 40 years with hardly any significant inflation rates, Europe and the entire English-speaking world are affected by massive price increases as a result of the COVID pandemic and war-related events. Many managers are experiencing inflation intensely for the first time and need to understand how to plan and act in such a situation in order for their companies to survive successfully.

How price increases propagate

Generalizing, price increases are the result of bottleneck situations. Bottlenecks can arise in various areas when demand is greater than available supply. Insufficient supply capacity is often due to:

    • Raw material availability in the required qualities too low
    • Lack of transport capacity or transport containers
    • Political/legal supply restrictions
    • Inability to comply (yet) with regulations on manufacturing processes or guarantees of origin
    • Insufficient personnel capacity for processing and handling
    • Too little equipment available for manufacturing or insufficient manufacturing capacity
    • Too much capital investment ris equired for manufacturing.

Such bottlenecks lead to cost increases for suppliers of material and services. They try to pass on the cost increases to their customers in the form of higher net selling prices. If this succeeds, the purchase prices for the (further) processing companies rise. These price increases must in turn be passed on to the next (production) level. If a company cannot successfully pass on its higher costs, it will sooner or later incur losses, become insolvent and go bankrupt.

Beating Inflation
Beating Inflation

At the end of this chain are the end customers, usually private individuals. If purchase prices rise for them, they consider which of the available products and services they will continue to buy, taking price increases into account. This is because they only have their disposable assets and regularly recurring income available for consumption. Customers usually opt for what they consider to be the best price/performance ratio.

Suppliers at all levels try to circumvent, delay and keep price increases as low as possible in purchasing by means of negotiations or changing suppliers. In sales, the aim is to pass on the price increases that have occurred. Whether this is fully successful depends on the preferences of customers on the one hand and on the behavior of competitors on the other.

In order to remain successful in inflationary times, one’s own company must succeed in interrupting the price increase spiral. Inflation is thus a challenge for all employees, because all functional areas are affected, and above all the entire management. Countless ideas for improvement have to be generated, evaluated and decided upon. Furthermore, the interruption of the inflation spiral has to happen quickly, because otherwise the financial result will suffer. Above all, the following must be adjusted:

    • The assortment to be offered and the assortment width
    • The pricing process from gross price to net revenue
    • The marketing, customer acquisition and sales processes
    • The distribution channels and the definition of target customers
    • The product development and design
    • The manufacturing processes and the input materials to be used
    • The purchasing process and the choice of suppliers
    • All administrative processes
    • The data integration and the automation of administrative processes
    • The investment planning as a result of the process changes.

Professor Simon estimates that most companies can only pass on about 50% of the inflationary cost increases on the procurement side to the customers; the entire cost side in the company must also make a contribution to the profit defense (p. 191).

The next post will go more into detail on which measures have how strong an impact on profits.


Costing or pricing 2

 Costing or pricing 2

Offer leatherette presentation folders?

In the analysis below the net planned revenues are related to the expected costs of the products, the costs of the planned marketing and sales measures and the necessary investments. This is used to assess whether the entire project will be profitable and can be released for implementation.

This requires a multi-year view, because investments in fixed assets (additional machinery, capacity expansion) are to be expected and the sales volumes as well as the achievable net revenues may change in the course of the project’s life cycle. In addition, it must be taken into account that expenses and costs are incurred at times different than the net revenues. The cash inflows and outflows of the individual years must therefore be made comparable. This can be achieved with dynamic capital budgeting.

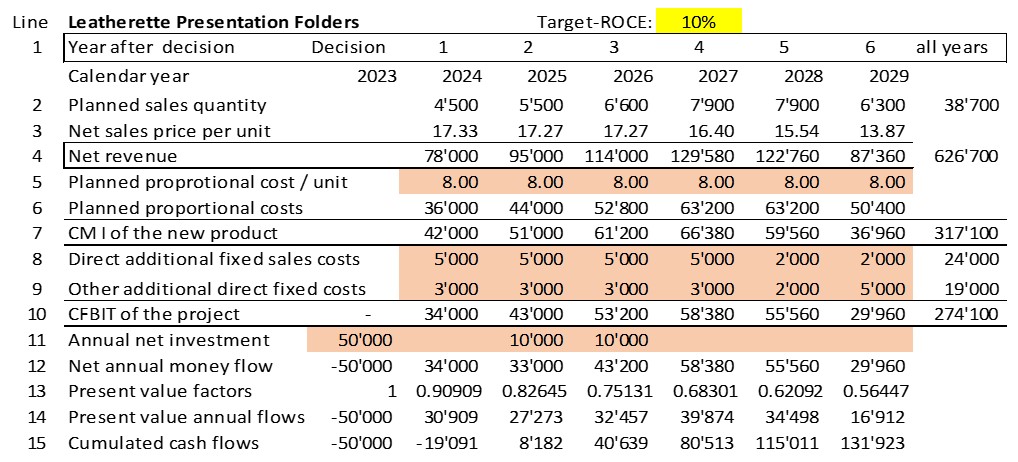
The expected annual net revenues (line 4) are taken from the table on planned sales/revenue development (cf. Costing or Pricing 1).

Since the leatherette presentation folder does not yet exist, the bill of materials and the routing for this product are still missing. As a basis for calculation, the consumption data of a product that is as similar as possible and has already been manufactured can be used. These are supplemented by the expected additional individual material items and production activities. This results in the proportional planned production costs per presentation folder (line 5). If higher purchase prices and proportional cost rates are expected in the years to plan, these cost changes can be taken into account for each planning year.  For the time being proportional product costs of 8.00 per presentation folder are assumed in all years. Multiplied by the planned sales quantities (line 2), line 6 shows the annual proportional planned product costs and line 7 shows the contribution to be achieved with the presentation folders in every planned year.

Costing or pricing 2

The annually expected additional fixed costs to be ready to introduce the presentation folder and to generate the annual planned sales quantities are entered in lines 8 and 9. These can be external costs for product-specific advertising, additional costs for the creation of product catalogs, external costs for supplementing the company’s own website and additional personnel costs for the support and administration of the new products. It is important to note that only items that lead to changed cash outflows are taken into account (no allocations).

The result is the annual expected net cash return from the project, i.e. the cash flow before interest and taxes CFBIT (line 10).

The CFBIT is first used to pay for the investments resulting from the project, i.e., additional machinery, capacity expansion of existing facilities, and possibly external rent for additional premises. Higher accounts receivable balances which are expected to follow from the increase in invoiced sales must also be taken into account. If the volume of purchases from suppliers also increases as a result of the new product, the accounts payable balances will increase as a consequence. As a result, the cash outflows only occur in the subsequent period (line 11).

The balance of the annual cash outflows and inflows is shown in line 12.

This line shows that the net cash flows of the years 1 – 3 will be sufficient to cover the new investments and the changes in accounts receivable and accounts payable in years 1 – 3. The payback period of the presentation folders project is a bit more than 2 years.

However, from the point of view of the owners (shareholders) and the lenders (banks), the project should also yield a rate of return in line with the market as they consider whether they should invest their money in Ringbook Ltd. or in another company. To convince the lenders and the owners of the profitability of the project, the management of the company should therefore discount the expected future net cash flows to the moment of the project decision.

For this purpose, the present value of the nominal annual cash flows at the time of the decision should be calculated. Example:

Assuming an interest rate (i) of 10% per annum, a cash return of 1,000 that occurs exactly one year after the project decision has a value of 909.09 at the time of the decision. This results from the discounting formula:

Present value = cash flow x 1 : (1 + i)^1 = 1.000 : 0.90909.

This discounting calculation is done in lines 13 and 14 for each year. The discounted annual cash flows were added up in line 15. The cumulative present value of the project at the end of year 2 is +8,182, which means that the introduction of the leatherette presentation folders will pay for itself after only two years, even taking into account 10% interest.

You can download the generally applicable model for quantifying investments, projects and strategic plans as an Excel model here and adapt it according to your needs.

The market interest rate of 10% used here is up to date for the German-speaking world. In our book 360°-Management, pages 243 ff, we calculated and published the market-driven interest rates of various industries in different countries in 2015. In 2022, it was found that the interest rates stated there are still up to date for German-speaking countries and for the USA.

Conclusion for the financial assessment of plans and especially projects:

    • Pricing comes before costing: Estimating possible sales quantities and net prices and comparing them with competitor offers is a prerequisite for assessing the profitability of projects.
    • Separate plans must be drawn up for direct customers and sales intermediaries, as net sales revenues vary widely.
    • Sales deductions reduce the contribution margin in the same way as proportional product costs.
    • The direct costs of acquiring new customers must be included in the plan as fixed period costs.
    • The sales and revenue plans have to be compared with the anticipated proportional product costs of the services and products. The resulting contribution margins I must at least cover the fixed costs of the projects.
    • The market and the salespersons determine the sales price and the net revenues, not the costs.
    • Full costs per product unit can be calculated but are not relevant for decision-making because of the fixed cost breakdown.
    • Feed-forward and feedback are normal in the planning process. It is important to continuously take into account the resulting changes in the plans.
    • Multi-year horizon: The expansion or contraction of the customer base as well as the company’s own range of products and services always have long-term effects. Therefore, multi-year considerations are usually relevant for decision-making. This speaks in favor of the application of dynamic and money flow-oriented investment appraisal.
    • Question the assumptions, create and compare several variants of the investment calculation. This makes it possible to include the consequences of different estimates in the decision-making process.

Costing or Pricing 1

Costing or Pricing 1

In management, the question often arises as to whether it is primarily the sales prices and the company’s own costs that determine the company’s profit, or the design of the product range and of the market presence. Should planning start with costing or pricing?

Mostly the market, i.e. the potential customers and the competitors, as well as the skills of a company’s salespersons make the price. However, only the excess of the net revenues over the costs incurred for them results in the company profit. The profit of individual products or individual customers can neither be determined on a cause-and-effect basis nor for a single year because the costs of the readiness to perform (fixed costs) cannot be charged to customers or products/services on a direct cause and effect relationship (see the post “Full product costs are always wrong!“).

Managers have to decide whether to add a new product or even a product group to their product range, to serve new sales territories or sales channels, or even to invest in new technologies. For such expansions often investments have to be made and new cost elements arise in order to generate additional sales and contribution margins.

First it is necessary to estimate sales volumes, sales prices and net revenues per product, because this pricing-oriented data creates the basis for planning and determining the necessary investments and costs. It is necessary to think from the market into the company. The following rough sequence emerges:

    1. Prepare ideas for new products or services.
    2. Analyze competing products or services and thus expected competitors.
    3. Estimate possible sales quantities and net prices in various market dimensions such as sales territories, sales channels, product groups.
    4. Plan the quantities and the net revenues per item, per sales territory and per sales channel.
    5. Estimate annual additional costs for marketing, advertising, sales promotion, customer service.
    6. Decide.

Only when estimated values for point 4. are available, it makes sense to plan the costs and investments necessary for the implementation.

To generate a plan-calculation Dynamic Capital Budgeting is the suitable instrument (see the post “Dynamic Capital Budgeting”). This is because it allows sales and net revenue estimates to be compared with cash outlays for new investments and expected costs, the payback period to be calculated and the present values to be discounted to the decision point. Existing contribution margin and cost/performance calculations can provide essential planning inputs, but they do not yet include the new products and submarkets. It is therefore advisable to first calculate the expected net sales and contribution margins in a separate table.

Offer leatherette presentation folders? (Costing or Pricing 1)

The management of Ringbook Ltd. is discussing the idea of adding high-quality presentation ring binders with imitation leather covers to the product range. These ring binders for presentation should help customers promote their own offers more successfully.

The leatherette folders are to be sold through the existing three sales channels (direct sales to companies, to retailers for resale and via online store). For the time being, sales are only planned in the home market (Switzerland).

Market assessment

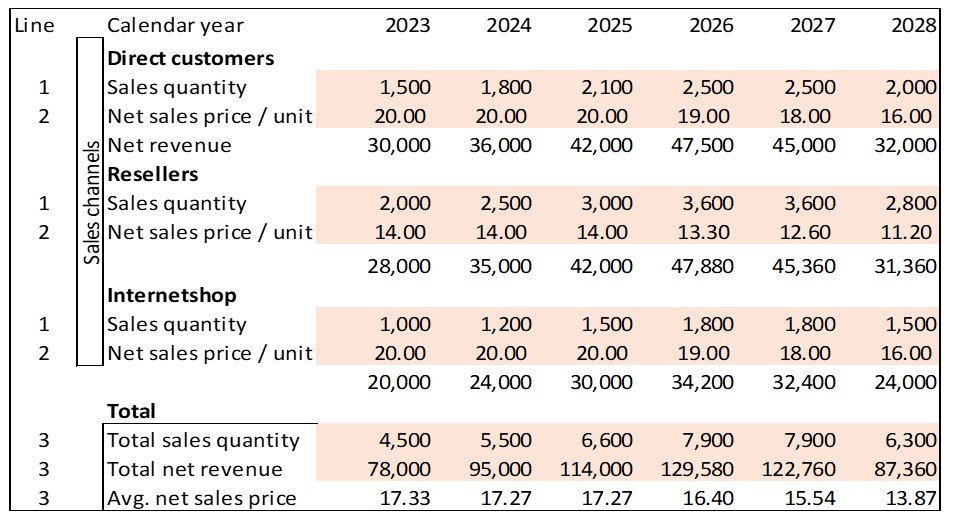
In an initial assessment, the sales management and the sales staff of Ringbook Ltd. agreed on the following potential net sales prices (after deduction of discounts of all kinds) and sales volumes for the Swiss home market:

Costing or Pricing 1

The salespersons in the respective regions estimated the sales volumes of presentation folders that they believe can be realized (line 1). The assumed development of the planned sales quantities shows that they assumed that the life cycle curve of the product will reach its peak in the fifth year and that subsequently the sales volumes will decrease.

Ringbook Ltd. grants its customers various discounts on list prices and on order values. The total average discounts granted to date have already been taken into account in the net sales prices. This explains the different net sales prices per unit (lines 2).

From this, the net sales to be achieved with the intended presentation folders were calculated for the individual years per sales area. Lines 3 also show the estimated average selling prices per unit.

The inclusion of presentation folders in the product range is intended to help Ringbook Ltd. be included in the inner circle of potential suppliers of sales support aids for all potential customers. This should help to continuously improve the company’s own market position.

The table with the sales channel-related planned sales quantities and net revenues is thus an approach to quantify strategic intentions. It is the basis for comparing the planned net revenues with the expected costs and expenses. Only this comparison can show whether the expansion of the product range will also improve Ringbook Ltd.’s financial result.