Determine the Deciding Purchase-Criteria

Determine the deciding purchase-criteria

The complete perceived benefit is determined on the basis of weighted benefit criteria. Not only the criteria that constitute the product or service are taken into account, but also service, added value and image elements. If it is a classic, haptic product, the constituent criteria are usually equivalent to the technical data: Engine performance, load volume, cycle frequency, compactness of dimensions, manufacturing tolerance or similar.

If the customer benefit analysis is created for a service, it is about the criteria that constitute this service. In the case of a logistics service, for example, these are the prompt delivery of the goods, in the case of a consulting service the technical competence of the consultants, or in the case of a training service the probability of passing the diploma examination.

Both in the purchase of haptic products and in the purchase of services, non-constituent, complementary services can play a decisive role. In the jargon of customer benefit analysis, one usually speaks of service criteria. Depending on the business, these include the professional quality of sales advice, delivery times, friendliness of service, warranty services, density of the network of service points, availability of spare parts, uncomplicated booking of an upgrade, availability of a hotline, etc.

Added-value criteria provide added value from the customer’s point of view, e.g., “recyclability” or “made in the United States”.

Image criteria evaluate the brand image or the image of influencers promoting the product. In business-to-business transactions, (project) references are often important, especially in new customer business. In existing customer business, on the other hand, the image criterion “worked great last time” can play a central role. It stands for a presumption of competence, on the basis of which the existing customer proceeds to purchase without further factual examination of all other criteria. Especially in a project business, it is often underestimated how important the project staff of today’s project are – they are the most important “salespeople” for the next project.

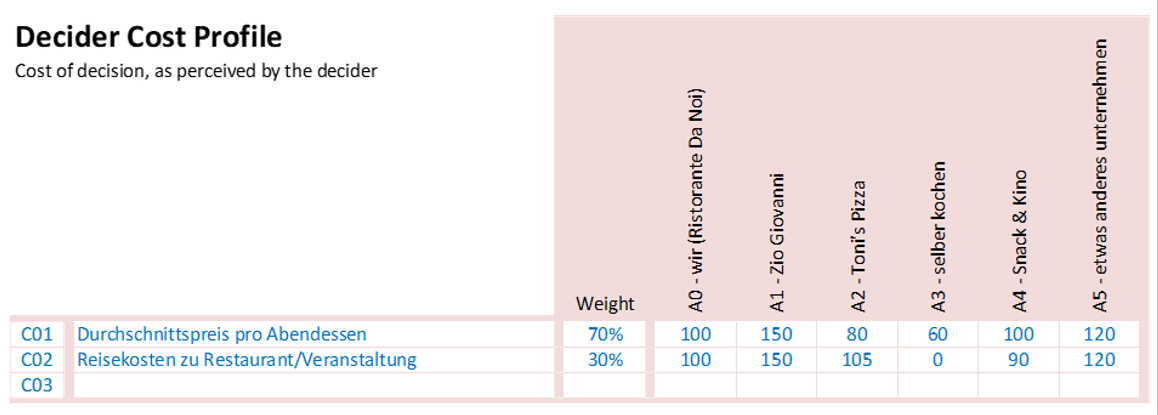
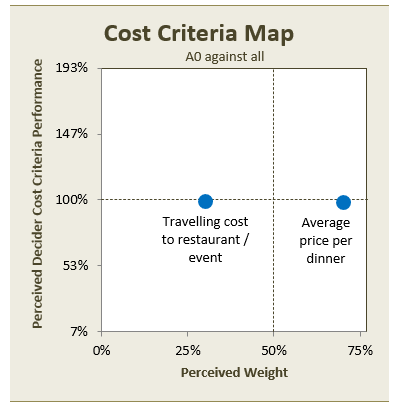
Analogous to the benefit, the total costs perceived by the potential customers are determined with weighted cost criteria. These typically include one-time and recurring monetary costs. One-time monetary costs include the sales price, but also one-time project investments (financial experts speak of Capital Expenditure, or CAPEX for short). Recurring monetary costs include maintenance costs, license costs, consumables, etc. (the financial experts speak of Operational Expenditure, or OPEX for short).

Although both CAPEX and OPEX are monetary values which the financial calculator can condense into a Net Present Value (NPV), it is advisable in the customer benefit analysis to clearly distinguish between these cost criteria. In the purchase decision, the calculation is usually not 100% financial, but political factors also play a role. Some customers do not like CAPEX and therefore weight the one-time monetary cost criteria higher than the recurring ones. Others do it the other way.

The non-monetary cost criteria also play a significant role in the purchasing decision. These include, for example, the time required on the customer side to purchase and operate a product. Other non-monetary costs that can play a role in the purchasing decision include the personnel capacity absorbed on the customer side, the space required, or the dilution of management attention.

Non-monetary costs can also include opportunity costs – i.e., the regret that by deciding to make a purchase, one forgoes the opportunity to buy something else, because there is no more budget available. Sunk costs, i.e., expenses from previous decisions, can also play a deciding role. If a buyer decides to buy a new IT platform, the investments already made in the old platform become obsolete. Controllers know that sunk costs have no place in decisions to invest in the future. Nevertheless, many customers take earlier expenses into account for political or emotional reasons. If product development and/or marketing do not take this aspect into account, their communication could miss the customer’s needs.

Cost criteria also include all kinds of risks that the customer associates with the purchase decision and which he wants to minimize. These include capital loss, currency, liability, or reputational risks.

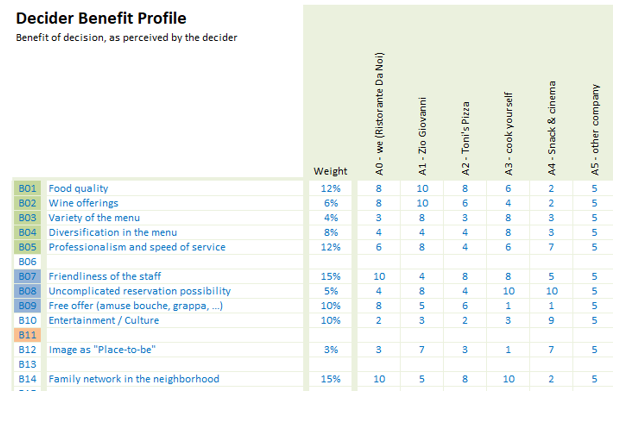
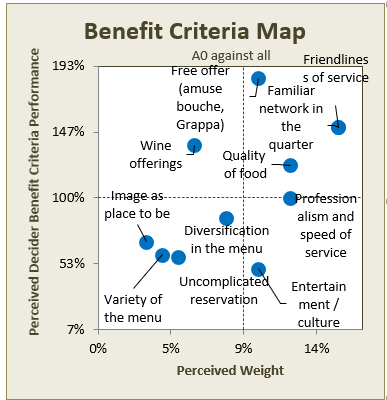
In the customer benefit analysis it is essential to analyze a decision from the customer’s perspective. Even if  the host is a wine lover, it does not mean that customers come to the restaurant because of the quality of the wine list. Perhaps the friendliness of the service is much more important to them – a benefit criterion that the host perhaps weights too low or overlooks altogether. Whether the service is friendly and courteous is judged (and told) by the customers, not the host.

Often it is not clear at first whether a criterion is more of a cost or a benefit criterion. Taking the customer’s point of view without compromise leads to the solution here as well. For the tightly calculating businessman, the gasoline consumption of a vehicle is a clear cost criterion. For the urban hipster who wants to brag about hi-tech to his colleagues, the (very low) fuel consumption is more of an image criterion on the benefit side.

Self-image versus external image

When conducting a customer benefit analysis, it is common to first create a so-called “self-image”. In doing so, managers record how they believe their customers “tick”. In most cases this results in quite robust images. These self-images should be validated with external images in a timely manner. Personal interviews, surveys or focus groups are recommended for this purpose.

Ideally, the self-image is created in a heterogeneous team in which the sales, management and technical perspectives are combined. The self-image created can then be checked for plausibility in a closer environment, e.g., with work colleagues outside the work group. In the next step, customers who have already been approached are consulted.

These steps involve the validation of the alternatives considered by the customer as well as the cost and benefit criteria. The weighting of the criteria shares and the comparative evaluation of the alternatives can be collected by means of web-based surveys.

At each stage, including large-scale surveys, it is important to allow open responses. Good, step-by-step preparation can prevent a large-scale survey from revealing that “the market” has been completely misunderstood. If this is the case, however, one should start again from the beginning. Otherwise the risk is to invest in a different business than the one in which the (potential) customers are looking for the best cost/benefit ratio.

Creating the Customer Benefit Analysis

Creating the customer benefit analysis

Creating a well-done customer benefit analysis first requires defining which purchase decision  is to be analyzed. This requires at least specifying the customer segment and an indication of the situation in which these customers make the purchase decision.

Secondly, the customer benefit analysis specifies the various alternatives that customers consider when making their decision. At this point, it is important to include not only the direct competitors, but all the possibilities that the customer considers in his purchase decision. These could also be: “Choose other technology”, “Do it yourself”, “Postpone decision again”.

Thirdly, the customer benefit analysis shows how the customers (and not the hosts, managers, salespeople, engineers, editors, etc.) assess these alternatives in relation to each other. To do this, the cost and benefit criteria are developed and weighted. Finally, it is determined how the various alternatives perform in the individual criteria. This makes it possible to assess which choices have a strong market position and which have a weak one.

Decider Benefit Profile
Decider Cost Profile

The following two tabular representations result for the restaurant example:

The Decider Benefit Profile lists the alternatives in the purchase decision in the first row. The benefit criteria are in the first column. To the right of the benefit criteria is the weighting. The matrix shows on a scale from good (10) to bad (1) how the customers rate the alternatives in the individual benefit criteria.

The Decider Cost Profile is structured in the same way. Instead of a scale of 1-10, however, an index is more practical: We cost 100, an alternative that is 50% more expensive costs 150.

The customer benefit analysis generates different graphical representations to evaluate the collected data. The central representation is the “Alternatives Map” already illustrated in the post “Customer Benefit Analysis”. It shows at a glance which alternatives are considered, what the cost/benefit ratio of each alternative is, and which alternative has the best cost/benefit ratio – and thus the best market position.

Two other representations are the “Benefit Criteria Map” and the “Cost Criteria Map”:

Benefit Criteria Map
Cost Criteria Map
Cost Criteria Map

While the “Alternatives Map” shows the individual alternatives, the benefit and cost criteria are shown individually in these two maps. The horizontal axis corresponds to the weighting: Low importance for the customer (left) and high importance for the customer (right).

The vertical axis corresponds to the performance. The horizontal 100% line corresponds to the average performance in the market under consideration. If the point in the “Benefit Criteria Map” is above this line, “Ristorante da Noi” performs better in this criterion than the market average. Below the 100% line, the position of “Ristorante da Noi” in this criterion is worse than the market average. In the “Cost Criteria Map”, the situation is exactly opposite: Below the line is advantageous for the provider, above is disadvantageous.

These representations promote a focusing of the discussion on where to start to improve the market position. The quality of the wine list is above average, but not very important to the clientele. How should this be dealt with? Can the customers’ perception of its importance be changed, e.g. through appropriate advertising? This would give more leverage to the already good performance. In the “Alternatives Map”, the point of “Ristorante da Noi” would move to the right, improving the market position, respectively increasing the probability of being chosen. Could proportional costs be saved if cheaper wines of slightly lower quality were offered? The freed-up funds could then be used to improve the “Entertainment / Culture” criterion. In this criterion, the “Ristorante da Noi” is not yet so well placed, but it is important for the (potential) customers.

Customer Benefit Analyssis: Alternatives Map
Customer Benefit Analysis: Alternatives Map

In terms of prices, the “Ristorante da Noi” is exactly average. There is probably not much that can be done about the travelling costs but lowering the food prices would improve the market position: In the “Alternatives Map”, the point of “Ristorante da Noi” would move down. Although the measure would reduce contribution margins, it would accelerate growth – actually the more important imperative for a new offer on the market!

Extensive details on market position and customer benefit analysis can be found in the book “Customer Orientation” by Markus Orengo.

Bibliography: Orengo, M., Kundenorientierung in Innovation, Marketing, Vertrieb, Organisation und Führung, 2. erweiterte Auflage, 2017, Verlag tredition Hamburg. If you need more information about Customer Benefit Analysis, english translation or the software tool, please mail to: markus.orengo@social-systems-engineering.ch.


Customer Benefit Analysis

Customer Benefit Analysis

A customer benefit analysis helps to quantify one’s own market position. However, the probability that a customer will buy from us and not from the competition can already be reliably read from a qualitative analysis. This saves time and prevents spurious inaccuracies that distract from the essentials.

Customer benefit analysis is based on the empirically well-supported assumption that customers compare the price/performance ratio of the alternatives they are considering in their purchasing decisions.

Customer benefit analysis determines the cost/benefit ratio from the customer’s point of view. The “benefit” is all the advantages perceived by the customer that he expects from the purchase decision. The “cost” covers all the disadvantages the customer associates with the purchase (not the manufacturing costs of the product or service).

In this context, not only easily graspable, rational criteria such as engine power (benefit) or price (cost) are considered, but also more vague, emotional criteria such as brand image (benefit) or reputation risks (cost). The customer decides in favor of the alternative that has the best cost/benefit ratio from his perspective.

Customer Benefit Analyssis: Alternatives Map

Customer benefit analysis: Alternatives Map

Example “Ristorante da Noi”

It is first necessary to specify exactly which purchase decision is being modeled. In the example shown here, “Ristorante da Noi”, a new entrant to the market, analyzes how he is positioned when neighborhood residents decide not to spend the evening eating in front of the TV. Accordingly, the “Alternatives Map” contains not only other restaurants, but also non-industry alternatives that customers consider when making this type of decision. Inviting some friends to cook and eat together is a valid option in this “buying” decision. The “Ristorante da Noi” must take this into account in its planning.

It is recommended that a second customer benefit analysis be made for the “which restaurant are we going to tonight?” purchase decision. This would focus on the submarket of those customers who have already made the preliminary decision to visit a restaurant. This sharper focus, however, hides various possibilities for potential customers. Perhaps “da Noi” could grow easier in the large market of “home cooking” with a catering service than with a frontal attack on the restaurants “Toni’s Pizza” and “Zio Giovanni”?

Private and business customers tend to buy where the perceived benefit is large and the perceived cost is small – in the graphic with the restaurant example, this is the bottom right corner. The alternative that is farthest from the fair value line in the bottom right corner has the best cost/benefit ratio and thus the highest probability to win the customer. This means the best market position for the specific purchase decision. In the example, this is “Cooking yourself”. Zio Giovanni” has the worst market position. From the customer’s point of view, he delivers the same benefit as “cook at home” but is around three times more expensive.

The safest prognosis for the constellation of this example is therefore that the alternative “cook at home” will gain relative market share the fastest. Ristorante da Noi” and “Toni’s Pizza” can also hope for an increase in relative market share, but much slower than “cook yourself”. The choices in the top half of the chart have a below-average probability of acceptance and are therefore likely to lose relative market share.

Market Position and Customer Benefit

The detailed market position describes the attractiveness of an offer – firstly from the customer’s point of view and secondly in comparison with the other offers this customer considers in his purchase decision.

Market position and company size

A good market position of a supplier corresponds to a high probability that his offer will win the bid against other offers which the customer also considers in his purchase decision.

Strictly speaking, market position is first a property of a single offer.

In businesses that make only a few offers with high sales volumes, such as the capital goods business, it may make sense to evaluate the market position of a single offer. In most cases, however, the market position is described statistically, e.g. for certain time periods, for similar customer segments or for similar product groups. For this purpose, absolute and relative market shares are determined (cf. the examples of market share determination in the post “Market Position”). However, a pure market share analysis – whether absolute or relative – is not sufficient for a strategic understanding of market position.

Relative market share

If the customer buys from one competitor and not from the others, this inevitably leads to a shift in relative market shares: One gains sales, all others stay where they were and thus lose relative to the winner. The change in relative market shares, in turn, correlates strongly with absolute variables such as sales volume, number of employees, etc. However, the correlation is not compelling. In declining markets, for example, it is possible to gain relative market share and still have to record declining sales.

Size is important for relative market share, but not always

From a management point of view, the following is essential: The probability that customers will buy from one company and not from another is, in principle, completely independent of the current size of the competitors. If, for example, a clever individual creates (and patents) a new, superior solution to an existing customer problem, this individual can quickly improve his market position compared to a large corporation that only offers the outdated solution.

Accordingly, size is an unfortunately not guaranteed, but nevertheless probable consequence of a good market position. In other words: The market position predetermines growth and thus future sales volume. Thus, it can be assumed that the group in question had a strong market position in the past and is therefore large today. If the group does not succeed in bringing its market position, which has come under pressure, back into shape through innovation, it will lose size, while the individual – if he does everything right and is also a little lucky – may become the large group of tomorrow.

There are interdependencies between market position and company size. For example, the limited production capacity of the individual can have a negative impact on his market position. If extensive, interwoven structures hinder consistent responsibilities or adequate adaptation to changing market conditions, size can also have a negative impact on market position. It is essential that managers clearly distinguish between market position and size: On the one hand, operational result variables such as sales, sales growth, absolute market shares and liquidity are considered. On the other hand, internal piloting variables and relative market shares are decisive for the market position.

To be able to state the position of a vendor “in the market”, it is of course first necessary to outline which market is to be analyzed. It is often the case that companies have a good market position locally. If, however, customers consider not only local offerings but also those of global players, the position in the global market must also be included in the strategic assessment. After all, it is of no use to the local champion if local customers prefer to buy from international players. In the end only one gets the definitive contract – all other competitors can only book costs, but no sales.

Market is a set of purchasing decisions

“The market” must not only be defined geographically. At its core, it is about buying decisions that have a different structure. For example, one can have a good market position with existing customers, but a poor one with new customers. Seen from the customer perspective, market is a set of purchasing decisions that are similarly structured. Customer benefit analysis helps to analyze the situation clearly.