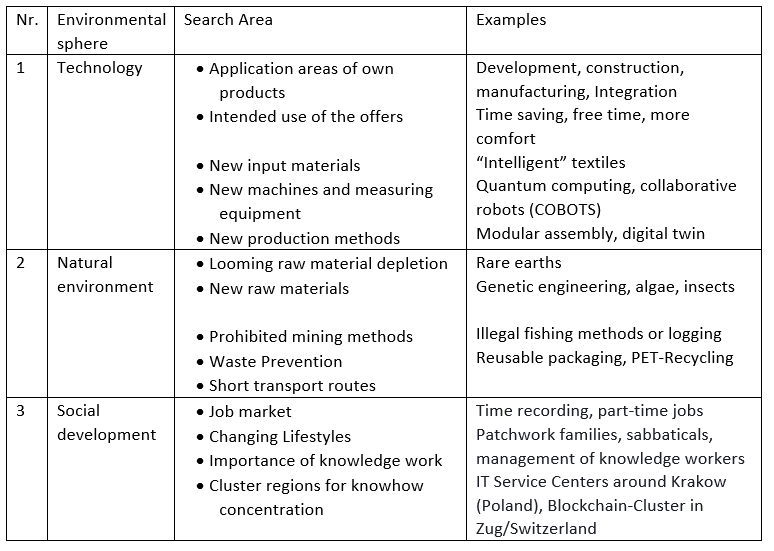
Expand the knowledge base for strategy development by capturing environmental trends.
Early Warning from Other Sub-environments like the technological, social and nature-related environmental spheres should be continuously evaluated. New findings and developments can become opportunities and risks for the company’s own success.
From the wide range of information available in print or electronically it is important to filter out reports and news that could lead to a change in strategic direction or even to an adjustment of the company’s purpose.
In order to limit the amount of data that potentially could be generated, a topic structure should be created to facilitate structured retrieval of the information collected. The search areas should be structured according to the analysis areas of the respective company.
It is advisable to regularly consult the resulting knowledge base in order to relate the findings to the company’s own strengths. This can lead to successful new applications or products.
Example: Auto emission of CO2 and other pollutants argue in favor of purely electrically powered vehicles. However, their range is still too small for a market breakthrough and it takes too long for the batteries of these vehicles to be fully charged again. New devices are needed that can force the current into the batteries quicker, as well as connecting cables that can transmit the high voltage without short-circuiting. Various companies have developed new products for this purpose and have thus opened up new areas of business.
The complete network for structuring the knowledge base
Starting from the “basic engine”, the network for the development of the company-specific early warning system was created in the previous posts. The terms of the areas to be monitored are on the outside of the network. The task is to adapt these terms to the specific needs of the company and to fill them with analytical data. In a later post we will discuss how early warning indicators for the search areas are developed.
Assess external influences on raw material prices and personnel costs.
Early Warning Signals from the Procurement Markets
The most important external factors for cost development affect personnel and raw material costs. Early warning indicators for these are critical.
In the short term, cost price fluctuations usually play a major role for raw materials. These are caused on the one hand by fluctuations in supply and demand and on the other hand by fluctuating exchange rates. In the medium to long term, which is the focus of early warning, it is increasingly legal requirements regarding permissible methods and procedures for raw material extraction (e.g. prevention of environmental damage, child labor) that influence raw material prices. Various raw materials will become more expensive in the medium term because their reserves are slowly running out. The trend is therefore to expect raw material prices to rise. As a result, there is an intensive search for substitute materials and for ways within the company to be able to manufacture with less scrap, setup material and cutting losses.
Only a few specialists seem to dare to make forecasts on the medium-term price development of individual raw materials. For strategic and medium-term planning, it is therefore advisable to work with scenarios (rising, constant, falling).
Early warning signals on the development of personnel costs come mainly from the labor market. The main factors to watch are the availability of suitably trained specialists and managers and the expected wage levels in the respective employee groups. The regulations to be observed with regard to social benefits, vacations and permissible working hours are becoming more and more stringent and increase personnel costs as well. Since trade unions and professional associations are the main drivers of these cost increases, their current demands, if realistic, should already be incorporated into the multi-year planning of personnel costs.
Integrate Presumed Market Developments into Planning
Presumed Market Developments and Planning
The basic engine from the post “Early Warning and Planning” shows that order intake is the most important factor for sustainable success and has consequences for almost all planning and control areas. Market-related early warning means analyzing and assessing the factors influencing order intake in the medium and long term and their interdependencies. These factors include disposable income, the behavior of competitors and the interest of retailers in actually promoting the products and services they offer.
The most important factor in attracting new customers, however, is the customer benefits offered by the company’s own offerings compared with those of its competitors.
Analysis of customer benefit
To receive an order requires that a customer (or a group) decided to buy the offer. Thus it is the customer who decides about the relevant criteria and their respective weight according to his needs.
If you want to improve the planning and management of your organization and make it successful in the long term, you have to know from your offerings (products, services) how well they meet the criteria used by customers. The better the customer’s purchase-deciding criteria are met, the more the company sells. This knowledge can be gained through customer benefit analysis.
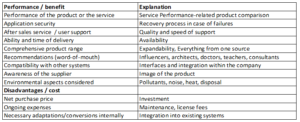
The purpose of a customer benefit analysis is to find out, which criteria future consumers apply when they decide for my offer or for another one. To do so, customers compare the benefits, performance and advantages (benefits) of a procurement option to its disadvantages, acquisition price, current expenditures in their application (cost). Then they rank the different opportunities to decide. The result is a cost-benefit-analysis for each examined option.
If such an analysis is consistently prepared from the buyer’s point of view it has the central advantage for salespeople, managers and controllers that it includes all aspects relevant to the buyer and also assesses the competitors. Thus it covers nearly all marketing aspects. The possible procurement variants are compared regarding:
If an organization can afford to outsource the preparation of a customer benefit analysis, there is a good chance that the main competitors will appear in the analysis and be fully assessed from the customer’s point of view. Our experience shows that even a less expensive analysis carried out by an organization’s own staff can yield significant insights. The prerequisite, however, is that the interviewees are repeatedly reminded to take the perspective of a potential customer.
In the book Customer Orientation in Innovation, Marketing, Sales and Leadership, Markus Orengo provides guidance on how to conduct a customer benefit analysis. He has also developed an Excel-based tool that provides step-by-step support for setting up the analysis and also presents the results graphically for decision-making purposes.
Overall market influences on order intake
Other factors of market activity, which a customer benefit analysis cannot depict, can become early warning information:
Conditions for resellers (i.e. dealers, craftsmen, doctors, software importers)
Sales and turnover development of competitors
New products, which could harass the own portfolio
International trade restrictions / tariffs / import or export bans
Development of new international standards which could prevent the sale of own products
Disposable income of the demanders / economic situation (can I afford it?).
Points 1. and 2. require the observation of the competition. However, the information usually comes late, as it is obtained by interviewing resellers or through publications. It is therefore important that the company’s own sales staff also use their customer contacts to find out about purchases made by their customers from competitors and to document the information afterwards in the internal reporting system (CRM system).
As markets become mature, mergers and acquisitions often occur as the large vendors try to increase their market share and thereby improve their cost position. Such events also have an early warning character. This is because they often occur in such a way that in mature markets, 5 – 6 groups worldwide hold 70-80% of the market shares and thus dictate the market rules (e.g. automobiles, personal computers, operating systems, cell phones). In such situations, the smaller companies often have to reinvent themselves and launch new products and applications to survive.
Information on mergers, sales trends, new technologies and products, trade barriers, and government regulations (items 3 – 6) provide important inputs for adjusting a company’s own policies and strategies. Decision makers must interpret the data and take it into account when revising plans.
One starting point for containing the effort and time required to obtain this kind of external data is it to subscribe for the services of a media monitoring agency that is individualized for the company’s own issues. This way of obtaining early warning data can also be used in research and development fields or for tracking disposable income.
Create the internal network to derive the main external influencing factors.
The partial environments of a company or an organization are constantly changing, see the post Environmental Changes are crucial for Management Control. These changes generate opportunities and risks for the continued existence and development of the company. Consequently, managers must regularly find out which changes in the relevant sub-environments could possibly occur or have already happened. The knowledge gained in this process should lead to decisions and, if necessary, to adjustments in strategic and operational plans. Since the variety of available data is immense and hardly completely manageable, it is necessary to determine, based on the existing internal situation, from which information sources relevant early warning information can be obtained for one’s own organization.
Early Warning and Planning
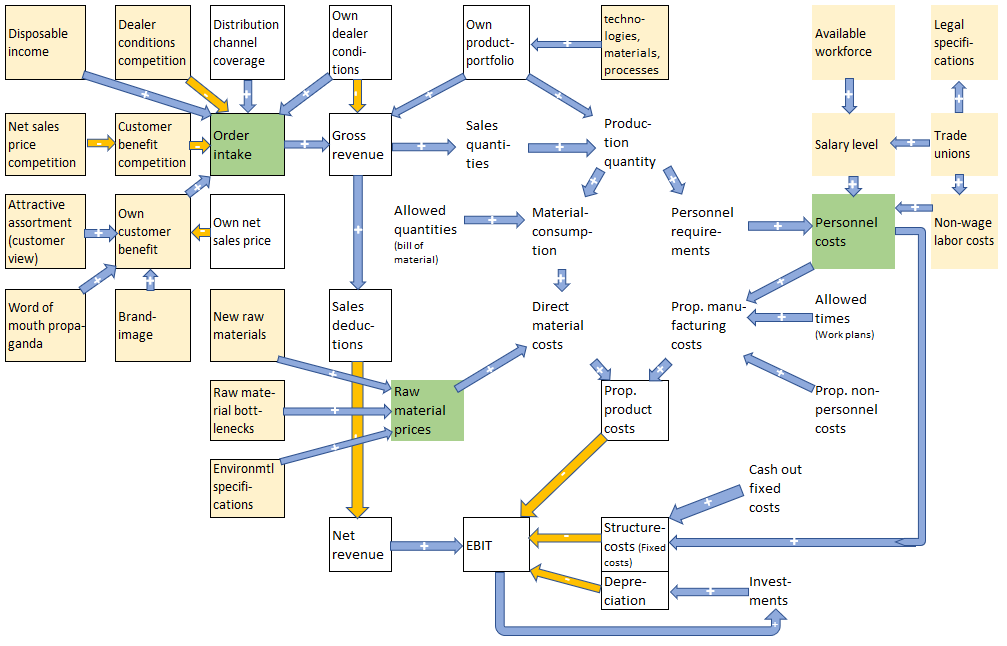
We follow the approach of creating a “basic engine” for the operation of one’s own company in the form of a network. Based on the interface between the company and the environmental areas, the external search areas can subsequently be derived. This approach is intended to channel the data search and thus help to manage the flood of data to be analyzed.
The basic engine represents the data, quantity and value flows of operational planning and control (one-year and medium-term). The processing areas from the revenue generation to the final result are connected by arrows. Arrows with a “+ sign” (blue) mean that the increase of the initial value also causes an increase of the subsequent value.
Example: Increasing sales quantities lead to higher production quantities and these again to higher material consumption. Increasing proportional production and fixed structure costs reduce the result as well as increasing sales deductions and are marked with “- sign” (orange). A proper network always contains positive (+) and negative (-) relationships. If one of the two relationships would be missing, the system would either explode or implode.
The basic engine can be further detailed to be company specific. From the picture it can be deduced which variables (green) at the outer edge of the network are significantly determined by external influences. These should be taken as a starting point when setting up an early warning system.
Order intake depends on internal conditions such as the offered assortment and the sales conditions, but more on external factors such as customer benefit or disposable income. Cost-determining factors are also driven by external developments (personnel costs, raw material prices, investment/plant requirements).
An early warning system should provide and keep up to date a forward-looking knowledge base on these developments in the sub-environments so that managers can draw on this information when setting the course for the future (cf. Bossler, A.,2010, p. 639 ff.).
Tracking capacity utilization and measuring process improvements are essential elements of piloting in production.
Piloting in Production
Piloting in Production is neccessary because also the development in the areas of production or services requires a multi-year view. Strategic intentions often lead to the rebuilding or further development of existing processes and capacities, while operationally the focus is on improving one’s own cost position compared to the competition (produce cheaper than the competition can).
Foreseeable capacity limits
Usually it can be assumed that larger quantities will have to be produced in the next years and that the variety of the product range will become broader at the same time.
This means it is necessary to build up and maintain personnel and machine capacities and to find ways to reduce the cost per unit. In terms of capacity, several questions arise:
When will plants or cost centers reach their capacity limit and require an expansion step? By comparing the monthly actual activity of a cost center to its available capacity, it becomes apparent which are the bottleneck cost centers. These could prevent the achievement of revenue and contribution margin targets.
When will the headcount of a unit have to be increased?
Can batch sizes be increased to reduce setup and setup-times per piece?
How can waste be reduced, i.e. down-times shortened, yields increased and scrap reduced?
Can transport and waiting times between processing steps be reduced?
The last two points are central elements of “Lean Production“. In order to be able to assess the intended effects also in terms of value, these effects should be mapped in management accounting. If waste is to be reduced, this must be reflected in lower proportional unit costs (material and labor) as well as in lower fixed costs of the cost centers. Lean production targets are therefore incorporated into bills of materials and workplans as standards to be achieved, and thus also into planned product costing. Reduced waste in production management leads to lower fixed cost targets in the respective cost centers.
Development of staff and its qualifications
Assuming that personnel requirements needed for production will increase in the medium term, further piloting information becomes significant for each cost center:
How many employees will retire and in which years?
How many trainees will have completed their education by then and could fill the vacancies?
What are the personnel requirements to be recruited on the labor market for the next years?
What training or knowledge deficits need to be addressed so that production can run as smoothly as possible?
Both in manufacturing companies and in the retail sector, scrape can be a significant waste factor. Scrapping is the result of too large purchase orders or too high production orders. It leads to additional fixed costs because:
material spoils after a certain time or suffers quality losses,
more than the dispatched quantity is produced in order to completely process the obtained material and thus not have to deliver leftovers back to the warehouse,
the sales department hopes to be able to sell the remaining stock later and therefore asks the production department to produce more than ordered.
It is therefore advisable for production and purchasing managers to monitor the development of scrapping costs on an item-by-item basis at least annually and, if necessary, to adjust planned production.
Despite the increasing use of information technology, the workload tends to increase in the area of production planning and control and in management. Keywords are e.g.: Master data quality, more detailed planning, batch tracking, complaints processing, documentation, production data acquisition and employee support. These internal tasks should also be recorded in the production data acquisition,so that it becomes analyzable for which jobs how much working time is used for each job and how hourly requirements change over time.
Measure continuous process improvement
The increase in the range of products offered led to more but smaller production orders in the Stamping shop. In addition, the quantity produced increased by almost 20% over 5 years (from 6,000 to 7,100 pieces). This increase could be managed by 4 people (including the boss) without additional personnel. Although the total production costs of the cost center have increased by about 5% in these five years (wage increases), the stamping shop nevertheless produces today at a lower cost per piece.
The following factors have contributed to this:
Starting in year 2 the relief of the cost center manager through the introduction of electronic production data acquisition. The time freed up allowed him to work more directly on the products.
Shorter setup times per production order.
Process-oriented training of the employees led to fewer errors and shorter processing times per piece.
Overall, waste was reduced to a gratifying degree (Lean) over the years. But at the end of year 5 the stamping shop is the bottleneck for production output. If sales and thus production volumes continue to rise, additional staff needs to be engaged on time.
From the graphical representation, the effects of these improvement measures can be seen when the analysis is approached in more detail:
Stamping shop full unit costs increased from 500,000 to 522,586 in year 5 (+4.5%). This is due to wage increases and price increases in supplies and operating materials.
Due to the process improvements mentioned above, the output produced increased from 6,000 units to 7,100 units, while the processing hours consumed for this purpose only increased from 6,000 to 6,450 hours. This explains why, in the graph on the right, proportional unit costs fell from 60.00 to 57.28 despite wage increases.
Fixed costs have decreased to 115,907 due to the introduction of operational data collection and due to the efforts of the cost center manager to perform internal tasks with less workload (left graph). As a result (in purely arithmetical terms), the fixed production costs per unit fell from 23.33 to 13.60 (right graph).
By reducing fixed costs and increasing productivity in manufacturing, this cost center has made an important contribution to improving the company’s cost position. As long as market prices remain the same, the company generates higher profits. If the competition lowers selling prices, e.g. to gain market share, the company can follow and still remain in the profit zone.
Observing the piloting variables of production and their development over time reveals where internal process and structural adjustments offer opportunities to strengthen competitiveness. Therefore, piloting is an essential part of integrated operational planning and control.
The quality of the customer acquisition process determines net revenue in the medium term.
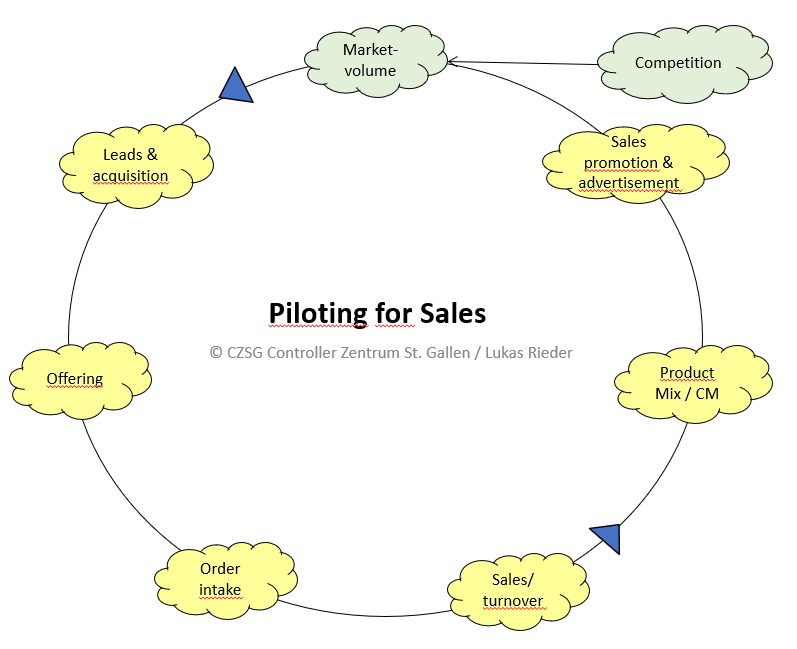
Todays net revenues are largely the result of previous marketing, sales and product management actions. Leads (qualified addresses for persons to be approached in specific companies) are the starting point for presenting an offering to future customers. The presentations should result in requests for proposals or quotes. These, if they are acceptable to the prospects, become incoming orders and ultimately sales. To plan actions, processes and investments in marketing and sales for the next year, leads are therefore important, albeit uncertain, piloting for Market Success variables.
Piloting for Market Success
To be able to recognize and track the developments in business initiation, it is advisable to work with time series analyses. The focus is on various questions:
How many leads are needed on average to receive an invitation for a presentation? For this purpose, the leads procured can be related to the visit invitations, i.e.: number of leads : invitations received, each in relation to one year. Since an acquisition call can be the result of a contact from previous years, the multi-year development of this key figure (moving average) should also be shown. The determination of this key figure requires that the leads and the agreed appointments are recorded in the customer relationship management system (CRM) in terms of content and date.
The contacts with the prospects (date) and the contents discussed should also be recorded in the CRM system. This makes it possible to evaluate the period between the initial contact and the offer request and to document the contents of the conversation. This makes it easier for the account manager to prepare the next calls.
If the (potential) customer requests a quotation, this should already contain the individual items offered with their prices and conditions in as much detail as possible. In this way, the open quotations can also be taken into account in sales and production planning. The basic data required for this (customer data, article data, discounting rules, payment conditions) is often kept in the ERP system, to which the CRM system is linked.
Relating the submitted offers/quotations to the number of leads generates more piloting information: A) Evolution of the average time between lead generation and offer over the years. B) How many leads have to be processed on average before an offer can be submitted. These metrics are important for the salesperson’s work planning, as they allow him to estimate how long it takes from the initial contact to the offering and how much working time it takes.
If an order is received, a comparison of the outgoing quotation and the customer order can be used to determine how many quotations have to be created in order to achieve an order entry and what period lies in between (average values per salesperson, territory, product group).
If the executed order can be invoiced in the ERP system, the time period between order entry and revenue generation becomes visible. This indicates to the salesperson whether he needs to increase his working time percentage for customer acquisition in order to meet his sales and contribution margin targets.
Dividing the order backlog by the average monthly sales shows how many production months are covered through the order backlog. If this value falls, this is an indication that customer acquisition must be intensified if sales are not to collapse in the medium term.
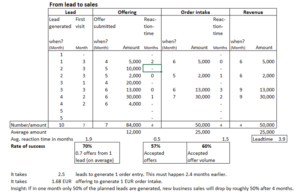
In the example below the data preparation and the resulting key figures can be traced over 5 periods (months):
In this example from lead and first visits to sales
10 leads were received resulting in 7 submitted offers with an average amount of 12,000 after an average of 1.9 months. 70% of the leads were thus successful.
4 of the 7 submitted offers were accepted (success rate 57%) resulting in an order intake of 50,000 (success rate 60%). Customers took an average of half a month to accept the offer.
Sales could be invoiced after 1.5 months on average after order entry. This results in a total lead time from the arrival of the lead to the generation of revenue of 3.9 months.
It takes 2.5 leads (10 : 4) to generate 1 order. On average this takes 2.4 months (1.9 + 0.5). To achieve 1 EUR order entry, an average of 1.68 EUR offer volume is required (84,000 : 50,000). Linking all of the above shows that if only 50% of new leads are generated in one month, the revenue from new customers will also drop by about 50% after about 4 months.
These key figures not only help salespeople manage their workload. Sales promotion and marketing or advertising departments can also use them to determine which actions they should take in the next planning periods. To do this, however, these departments also need to know which products they should focus on promoting by looking at contribution margins per unit. In addition to strategic considerations, contribution margin analysis at the product level is also very important. The main products to be promoted and supported with sales promotion campaigns are those that generate a high contribution margin as a percentage of sales or net income.
Article-related contribution margin accounting (planned and actual) provides the necessary information for this (see the post Contribution Margins to Cover Structure Costs ). In the CM-calculation, it can be calcuated in plan and actual how many cents are left over from one EUR of sales to cover fixed costs and generate profit (EBIT). Advertising and sales promotion should therefore direct their actions towards items whose CM I in % of sales increases over the years or at least remains the same, as the market position allows to enforce higher net sales prices or because the proportional manufacturing costs of these items decrease over the years due to internal process improvements.
All the data elements mentioned in this post stem from internal company data. They help to plan the actions of the near future but have nothing to do with strategy yet. That is why we refer to them as piloting variables.
The cycle described above “from lead to sales” relates primarily to the initiation of profitable business with new customers. The analyses of developments in past years show where the greatest opportunities for success exist and can be seized.
For the successful further growth of the existing and future business, further piloting data must be considered. This is the subject of the post “Analysis of previous sales developments”.
The main data sources for identifying shifts in sales are invoicing and planned to actual comparisons in the cost centers of sales, marketing and sales promotion.
The presentation of changes in sales over several years is the easiest way to start the analysis. The evaluation of billing data shows where to start in order to maintain previous sales successes and to generate new ones.
However, this only provides an overall view from which the causes of the changes cannot be identified. To be able to create multi-dimensional and multi-year analyses, it is necessary to ensure in the ERP system that the key variables for all dimensions to be evaluated are contained in the individual billing line. These include:
Starting with the customer, the region, the country, the salesperson, the sales channel and often the sales agent can be detetermined. Starting from the item number, totals can be obtained by product group or assortment. If the analysis of sales is aggregated starting from the individual billing line, the change in gross and net sales as well as net revenues can be shown for all market dimensions over several years and in all aggregation levels (absolute, percentage changes, graphical representation).
If the proportional standard product costs of the product sold in the corresponding year are also deducted from the net revenue per billing line, the realized sales contribution margin is obtained for each item. This makes it possible to determine what contribution the sale of an individual item has made to covering fixed costs. In the multi-year view, it is thus possible to see how the contribution margins of individual products have changed in both the product and the customer dimension.
In the example company Ringbook Ltd., a pivot table from the ERP system is used to merge the billing data with the proportional standard product costs. Although the resulting file is very extensive, it can be evaluated according to a wide variety of criteria. The yellow fields in the extract mark the input elements to be entered, the others are linked from master files and calculations.
Based on this table, sales, net revenue and contribution margin analyses can be created for various time periods up to several years:
The salesperson of the sales territory East-Central Switzerland lost many stationery and office supply stores as customers in 2012 and 2013 due to business closures and sales slumps caused by major distributors and online shops. Although he gained some new customers, sales did not grow significantly. By increasingly promoting the high-margin products and by strictly adhering to the discounting rules, he has managed to increase the CM I as a percentage of gross price. This can be seen not only in the key figure CM I in % of gross sales, but also in the fact that absolute CM I has increased more strongly in percentage terms than sales from 2011 to 2015. Ringbook Ltd. does not pay commission as a percentage of sales, but as a percentage of realized CM I. Therefore, the sales representative also earned more commission.
From the analysis of the order and billing data, further signals can be gained for operational marketing and sales planning:
ABC analyses by customers and products in terms of sales and contribution margin, cf. in the book Management Control System, chap. 7.2):
Which are the 10 largest customers (cluster risk)?
What are the C-products, i.e. those that contribute only 5 – 10% to the total contribution margin volume? These should be discontinued in favor of the A and B products because they cost more than the revenue they generate.
Runner / sleeper analysis: Which are the 10 items with the highest sales volumes and which are the 10 with the smallest?
Listing of lost and newly acquired customers as well as the average number of the active customers
Repurchase rate (compare quantity and value of orders per customer over several years).
If sales and contribution margins are related to the working hours to generate them, the average CM per labor hour for salespeople, sales managers, marketing and product promotion can be determined. This metric improves especially when efficiency gains in operations have been achieved.
It is as well worthwhile to set the development of marketing, advertising and sales promotion costs in relation to the generated contribution margins of a product group, sales territory or sales channel in a time series. This provides empirical data on how long it takes for a campaign to pay off.
Strategies are indispensable for the sustainable success of a company. But learning from (sales) experience should also be continuous. The aforementioned piloting key figures serve this purpose. Only their improvement makes a strategy a success.
Developing the personnel capacities, abilities and skills is a prerequisite for short and mid-term success.
The management accounting system and the enterprise resource planning system (ERP) contain the performance and value-based data needed for under- and over-year operational planning and control. But building up and maintaining personnel capacities and developing employees’ skills and abilities often requires longer periods of time, either because suitable personnel are hard to find or because specific training and continuing education take longer. Piloting personnel capacities is necessary to have the relevant capacities, skills and abilities ready on time. This requires recording and maintaining various personnel-related data
Piloting Personnel Capacities
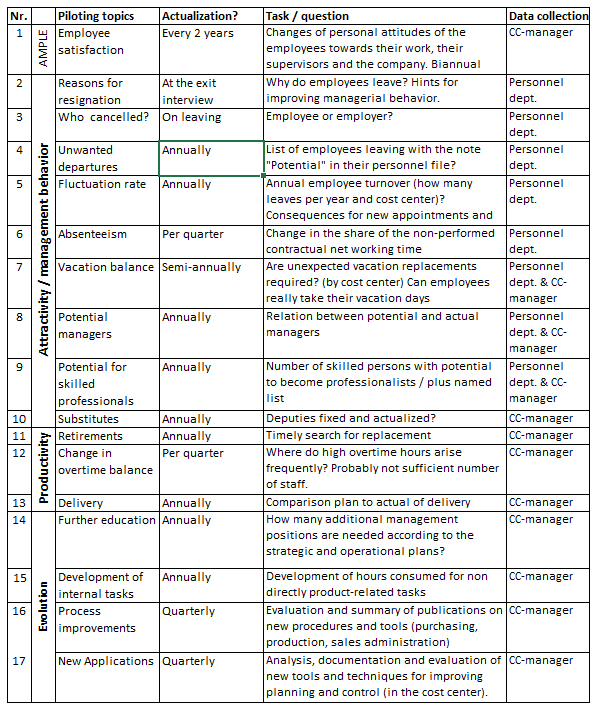
Cost center managers (and their supervisors) periodically need to be able to analyze changes in their staff and take them into account in their decisions. In the foreground of such piloting considerations are the top controls Attractive Employer, Evolution and Productivity (cf. the post AMPLE for Sustainable Success). In our opinion, the essential sources for such data are the database of the personnel administration area as well as the personal memos of the managers.
In order to ensure that a management area (cost center) is always ready to perform and that necessary personnel developments are not forgotten, it is advisable to periodically track the following information:
Organizations need to develop strengths and generate potentials for success by building and maintaining internal capacities while mitigating impending weaknesses. Yet the hectic pace of searching for everyday successes and planning for the near future often leads to neglecting medium-term developments in planning and control.
Piloting information should ensure that essential planning and implementation tasks for the medium-term future of an organization are not forgotten. The aim is to build up the potential for medium-term success timely. With appropriate and responsibility-related indicators, managers in all areas should be able to recognize whether they are developing their area in the medium term in such a way that the strategic goals of the organization can be achieved. Questions for this topic include:
Will we have the necessary managers and specialists in good time to realize our development plans?
Which positions will have to be filled in the near future as a result of retirements and departures?
In which areas are capacity bottlenecks (personnel and plant-related) to be expected in the near future?
In which areas is it necessary to build up know-how in order to achieve the targeted market positions?
What improvements in efficiency can be achieved in the medium term to maintain competitiveness?
We have chosen the term “piloting“ because this type of information processing pilots operative planning and control in advance. The main purpose of internal company information is to ensure that the organization will be able to meet the future challenges of environmental developments and create the conditions for implementing its own strategic objectives. Since this work is primarily to be carried out in the functional areas, the potential input control parameters are subsequently worked out area by area.
Sustainable organizations need to identify opportunities, avoid or mitigate risks, and find and assess new market potentials. Milk has been around since time immemorial. Who still buys raw milk directly from the farmer (and likes to drink it)? Supply and consumption needs have changed, as have the forms in which products and services are presented.
Early warning
Early warning is intended to help an organization to recognize emerging or at least presumed developments in the business environment early enough to be able to react. It is about finding opportunities for future business fields and identifying threats that could limit or even prevent the success of existing and future business.
Early warning cannot create certainty. However, it should lead the managers of an organization to consciously deal with ongoing or emerging changes in the various environments and take the findings into account in their strategic and operational planning decisions.
Following and evaluating new developments in terms of needs, attitudes, available materials and services, legal requirements and political trends is not only very time-consuming; there is also no guarantee that nothing is forgotten or fails to appear on the radar.
In order to limit the diversity somewhat, two approaches are used in our book to identify the relevant developments in a structured way and to prepare them for the planning process:
General observation of focal points in reporting on the various sub-environments
Derivation of specific early warning indicators that could influence the success of existing and future own strategic business areas.
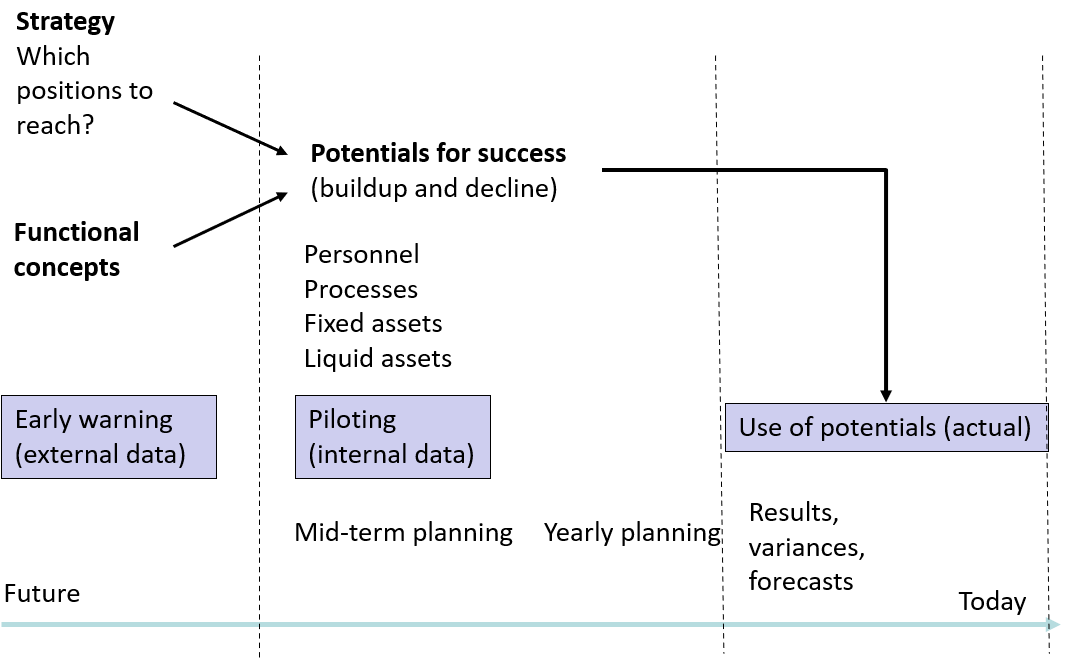
In summary, the following picture emerges:
Early warning should help to define the strategies with their basic parameters and to determine the resulting requirements on the functional concepts.
In addition to the strategic insights, the early warning system should disclose which internal developments are to be realized by when so that the potential for strategy realization is available in good time.