
Customer Benefit Analysis
A customer benefit analysis helps to quantify one’s own market position. However, the probability that a customer will buy from us and not from the competition can already be reliably read from a qualitative analysis. This saves time and prevents spurious inaccuracies that distract from the essentials.
Customer benefit analysis is based on the empirically well-supported assumption that customers compare the price/performance ratio of the alternatives they are considering in their purchasing decisions.
Customer benefit analysis determines the cost/benefit ratio from the customer’s point of view. The “benefit” is all the advantages perceived by the customer that he expects from the purchase decision. The “cost” covers all the disadvantages the customer associates with the purchase (not the manufacturing costs of the product or service).
In this context, not only easily graspable, rational criteria such as engine power (benefit) or price (cost) are considered, but also more vague, emotional criteria such as brand image (benefit) or reputation risks (cost). The customer decides in favor of the alternative that has the best cost/benefit ratio from his perspective.
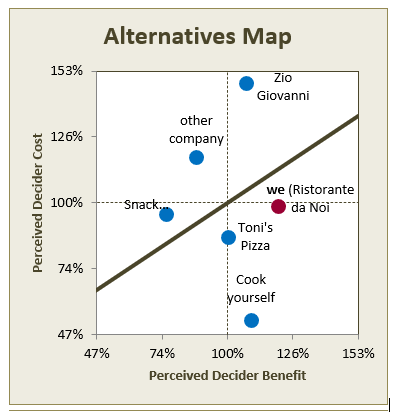
Customer benefit analysis: Alternatives Map
Example “Ristorante da Noi”
It is first necessary to specify exactly which purchase decision is being modeled. In the example shown here, “Ristorante da Noi”, a new entrant to the market, analyzes how he is positioned when neighborhood residents decide not to spend the evening eating in front of the TV. Accordingly, the “Alternatives Map” contains not only other restaurants, but also non-industry alternatives that customers consider when making this type of decision. Inviting some friends to cook and eat together is a valid option in this “buying” decision. The “Ristorante da Noi” must take this into account in its planning.
It is recommended that a second customer benefit analysis be made for the “which restaurant are we going to tonight?” purchase decision. This would focus on the submarket of those customers who have already made the preliminary decision to visit a restaurant. This sharper focus, however, hides various possibilities for potential customers. Perhaps “da Noi” could grow easier in the large market of “home cooking” with a catering service than with a frontal attack on the restaurants “Toni’s Pizza” and “Zio Giovanni”?
Private and business customers tend to buy where the perceived benefit is large and the perceived cost is small – in the graphic with the restaurant example, this is the bottom right corner. The alternative that is farthest from the fair value line in the bottom right corner has the best cost/benefit ratio and thus the highest probability to win the customer. This means the best market position for the specific purchase decision. In the example, this is “Cooking yourself”. Zio Giovanni” has the worst market position. From the customer’s point of view, he delivers the same benefit as “cook at home” but is around three times more expensive.
The safest prognosis for the constellation of this example is therefore that the alternative “cook at home” will gain relative market share the fastest. Ristorante da Noi” and “Toni’s Pizza” can also hope for an increase in relative market share, but much slower than “cook yourself”. The choices in the top half of the chart have a below-average probability of acceptance and are therefore likely to lose relative market share.