Activity-Based Costing
Activity-Based Costing (ABC) is an approach to costing that focuses on activities as the fundamental cost objects, then uses the cost of these activities as the basis for assigning costs to other cost objects such as products, services or customers. In the Management Accounting System proposed here this cost charging should only happen based on the planned proportional costs of the serving cost centers. The managers of the receiving objects are neither responsible for the fixed costs nor for the variances in the serving cost centers.
Actual cost proof
Enables the cost center manager to access all documents that led to cost debits in a period.
Bill of materials
A specification of the quantities of raw materials, purchased parts and semi-finished products required to produce one unit or a released production order.
Charging internal services provided (ISP)
This occurs when the following prerequisites are fulfilled:
The issuing cost center must plan costs that are directly caused by its activity level,
The receiving cost center can decide for itself if it wants to consume the service or there is an automatic mechanism that with more units in the receiving cost center, more activity has to be performed by the performing cost center (for example, maintenance work required after every 1,000 operating hours).
In the best-case scenario, the receiving cost center can decide for itself whether it procures the service from internal or external contractors.
Check
A check is a necessary but not sufficient element of feedback-loops. The actual results of any activities are assessed and compared with the corresponding target values. This is followed by a variance analysis and the decision as to with which corrective actions the targeted situation can be restored.
Contribution Margin II or CM 2
Misleading term in multilevel and multidimensional contribution accounting. CM II is reported by various ERP vendors as the difference between net revenue and full product cost. Due to the allocations necessary to calculate the full product cost, this CM II is no longer a real CM. In the relevant literature, e.g., Kilger (1988, p.73) or Kilger, Pampel, Vikas, (2002, p.531), CM II does not occur with included fixed costs. We recommend using descriptive names for the levels after CM I, since other fixed costs are to be deducted from CM I in the product dimension than in the customer dimension.
Controller
Controllers provide management support to managers at all levels. They develop and implement all necessary instruments and systems that managers need for performance and value-based integrated planning and control (see the Controller’s Dictionary CWB, and the mission statement of the International Group of Controlling).
Controlling
Controlling is managers’ task (keep your business under control). With their instruments and advice, controllers enable managers at all levels to carry out controlling.
Cost allocation
“The assigning of indirect costs to the chosen cost object (Horngren, 1999)”. It makes sense to allocate costs directly dependent on the activity level of a serving cost center to other cost centers or product units, since these are proportional production costs. However, fixed cost center costs can never be correctly allocated to other cost centers or products due to a lack of a direct cause-and-effect-relationship. This is why fixed cost allocation does not occur in a truly decision-oriented management accounting system.
Cost of sales method
Under this method the net revenues for the period are compared with the product costs of the products sold during the period. The product costs of changes in inventories of semi-finished and finished goods are reported in inventories.
Cost position
A company has a better cost position than that of its competitors if its value-added costs per unit are lower. While it may not be possible to precisely calculate this figure, cost-cutting opportunities must be sought constantly and everywhere in the company in order to survive price competition and to maintain profitability.
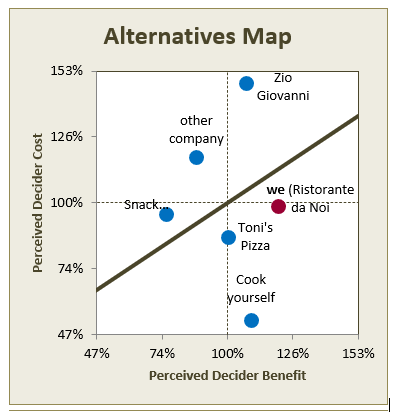
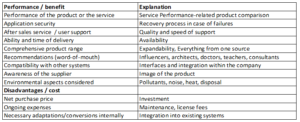
Customer benefit
Ratio of the benefits that a customer expects from his purchase decision to the disadvantages he incurs with the purchase (his own application costs). Also known as the cost/benefit ratio.
Delivery reliability
Measure of the degree of compliance with agreed delivery dates. Delays are usually measured in days or hours. This key figure can be used for vendors, production items, warehouse receipts, and deliveries to customers.
Disburdening costs
Costs charged from one cost center to another or to orders (like with credit and debit accounts in financial accounting). This transfer of costs leads many cost center managers to believe that it is good if they can pass on their own costs (including those allocated) in full or even with a surplus to others.
From a business point of view, disburdening makes no sense. Costs are budgeted and incurred in the serving cost center and should be controlled there. The proportional costs of the services rendered are charged to the receiving cost centers or orders. The planned fixed costs and the spending variances remain in the origin cost center. From there, they are transferred by means of stepwise contribution accounting.
Effectivity
Effectivity means “Doing the right things”.
To become effective you need to fix objectives (which results do you want to achieve?) and then to define the key results that will be achieved when the objective is met. See also OKR Objectives and Key Results.
Efficiency
Efficiency means “Doing things right”.
If you find a possibility to do a production step in shorter time, you become more efficient.
Flexible budget / Should-be costs
The flexible budget is the planned cost adapted to the actual activity level of a cost center. Calculation formula: Planned fixed costs + (Actual activity / planned activity x proportional plan costs).
The flexible budget thus indicates what costs (in total) a cost center manager should have incurred at an actual activity level. In other words this figure represents the costs that “should have been”. This is the suitable yardstick for comparison with the actually incurred costs, as it aligns the plan to the actual performance.
Free samples
Samples of a company’s product distributed free, often as an introduction to potential customers. They are part of the costs of a sales order or of a customer agreement. Since inventory withdrawals are necessary for these, the proportional standard costs per unit are to be used for the evaluation.
Functional concepts
Medium-term plans to develop support functions needed to successfully support the achievement of strategic product/market objectives. Functional concepts (functional strategies) are always derived from product/ market strategies.
Functional diagram
Two-dimensional representation of tasks and the persons or organizational units involved in their fulfillment. The tasks are listed in the rows, the participants in the columns. The contribution of the position is entered in the resulting fields by means of an abbreviation.
Good unit or piece
Product unit that meets all qualitative specifications and can be placed in inventory.
Holistic
Integral, integrated, to look at something in its entirety.
An integrated performance management system must take a holistic view of a company’s activities, including all its dimensions, including changes in the current and future (partial) environments of the company.
Internal tasks
All work performed in the cost centers that is neither directly caused by the manufactured and sold products, nor requested by other cost centers according to their free will.
Key figure system
Mathematically or logically linked combinations of several key figures (absolute or relative numbers with a special meaningful value). Key figures can be derived from planned values or from actual data and serve as a yardstick to represent cause and effect of processes in a causal relationship (CWB, p. 140 f.).
Key Performance Indicators (KPI)
Quantifiable measurements that reflect the critical success factors of an organization. (IMA Management Accounting Glossary).
Machine-hour rate
A machine-hour rate is formed to charge the directly performance-related machine costs (energy, preventive maintenance, lubricants) as well as the performance-related personnel costs of the machine cost center to the products and orders.
Management control
An organized, integrated process and structure through which management attempts to achieve enterprise goals effectively and efficiently. It provides well-defined units of measurement and evaluation, measures actual performance, and emphasizes continuous comparisons of actual with planned or budgeted performance, and taking corrective action and forecasting. (IMA Management Accounting Glossary).
Management Control is the process by which managers at all hierarchical levels ensure that their strategic intentions are realized (see the definitions of R. Simons (in “Levers of Control”) and R. Anthony/V. Govindarajan (in “Management Control”).
Management Control System (MCS)
Consists of the instruments needed to practice management control. The instruments can be divided into three main groups: 1 Management accounting for operational planning and control, 2 Piloting information for planning and control of mid- to long-term internal developments, 3 Early warning information from outside the company to support decision taking for the future development within the changing environment (strategy).
Material quantity variance
The difference between the precalculated and actual quantity of a raw material or semi-finished good used to produce a given output, valued at standard proportional cost per unit.
Net proceeds
Gross selling price less all possible sales deduction items.
OKR
OKR or Objectives and Key Results is a further development of management by objectives. Intel and Google in particular achieved great success with the working group-related definition of objectives to be achieved and the regular measurement of the (financial) results achieved during the year.
Each team member is responsible to the team leader for achieving the results. This applies to content, deadlines, costs and revenue.
Plan
To intend, be determined, be willing, aim, have in mind, seek. “Planning” is understood here as a creative act that leads to the determination of the results to be achieved together with the allocation of necessary resources as well as the denomination of procedures needed. A plan also serves as a basis for comparing what has been achieved with what has been intended (feedback-loop).
Planned activity level
The product-related activity that a cost center is to perform in the planned year. It is derived from production planning. Planned activity level is specified with the reference factor unit (RFU) of the cost center that describes the cause of the costs (usually employee hour).
Production planning (Rough planning, Order planning)
Planning the quantities of each product to be produced for a year. For this purpose, the products must be broken down into their individual parts according to the bill of materials so that it can be seen how many units are to be produced per item. The capacity requirements per cost center are then calculated using the standard times in the work plans. Rough planning is intended to show whether the available production capacities will be sufficient to process the demanded program. The capacity requirements are then the planned activities of the individual cost centers.
Real production orders are created based on the current requirements. They contain the order specific BOM and the work plan. This information is used to reserve capacities in the cost centers (dispatching). The production order data is the technical basis of the preliminary costing of an order.
Purchase price variance
Occurs when the actual purchase price for a raw material or service differs from the planned (standard) price at the time of purchase. The variance should be reported so that internal consumers (production, cost centers, sales) can distinguish between the share of the variance due to market effects and the share due to their own variances (material and working time).
Rolling plans
If new orders are received with due dates, they have to be included in production planning for the next period. Cost center plans and item-related standard costs should not be changed in management during the year, as they contain the objectives to be achieved. The incorporation of new or unplanned influences happens in the precalculation of orders and in the forecast (for the target- and result-oriented area). A forecast is made based on the expectations of the forward-looking manager, not on the basis of projections.
In medium-term planning with a multi-year horizon, rolling plans are the norm, since the existing plans for subsequent years are drawn up based on the current results achieved and considering the changes that have occurred since the last plan adjustment.
Routing variance
This is the cost-consequence of a production run that was performed in other cost centers or on machines other than planned in the precalculation.
Sales deductions
Reductions of the price received from the customer which the company has to bear (e.g., bonuses, reimbursements, cash discounts) as well as cost elements to be borne by the company because of the contractual arrangement with the customer (e.g., non-invoiceable freight, transport insurance, transport damage).
Service level agreement (SLA)
An agreement or a point of intersection between a customer and the service provider for recurring services. The aim is to make the control possibilities transparent for the client by describing in detail the guaranteed performance characteristics, such as scope of services, reaction time and speed of processing. An important component here is the quality of service (service level).
Service providers can be external contractors, or one or more cost centers. The ordering party is the community of cost centers receiving the services. SLAs regulate quantities, qualities, deadlines and availabilities. Cost allocation to the receiving parties should not be part of an SLA, since the costs are to be controlled by the service provider.
Spending variance
The difference between “should-be costs” (i.e., flexible budget costs) and actual incurred costs. If the actual costs in a cost element are higher than the target costs, this results in a negative variance because the difference has a negative effect on the company. A positive variance shows the size of realized productivity improvement in a cost center.
Strategy
The way that an organization positions and distinguishes itself from its competitors. It is the basic business approach an organization follows to meet its goals. A strategy defines the product/market combinations to be reached and the future potentials for success to be built up in a measurable and verifiable form. A strategy is formulated for a Strategic Business Unit based on customer needs. This means that a corporation can follow several strategies at the same time. Strategy implementation always requires operational planning and its execution. To do so, changes in the functional areas are often a prerequisite. These are planned in the Functional concepts.
Sustainable
The ability of a company / system to continue to exist successfully despite changes in its surrounding environment.
Total cost method
A method for the presentation of an income statement which compares the net revenues of a period with the total costs/expenses incurred in the period, broken down by cost type. Since revenues refer to the quantity sold, but costs are incurred based on the quantity of goods produced, the change in the value of inventories must be shown to make the basis for reporting revenues and costs consistent.
Value-added
The difference between net sales and all purchased and consumed inputs (material, energy, all external services purchased against invoice or cash).
Variable costs
These correspond to proportional product costs. However, the term “variable” should not be used, since all too often the proportionality of the costs to the quantity produced is confused with the controllability of costs (CWB, p. 200).
Wage provision
Wage provisions must be booked if work has been performed but not yet settled and paid out to the employee (holiday pay, overtime, flextime). Such positions reduce the monthly result and must therefore be recorded.
Work plan
A description of the processes to be carried out during the manufacture of a product, indicating the cost center and the time allowed to carry out the individual tasks (similar to the preparation descriptions in a cooking recipe).
Working time variance
Occurs when the allowed (target) times according to the work plan are different from the actual services on the order.