
Creating the customer benefit analysis
Creating a well-done customer benefit analysis first requires defining which purchase decision is to be analyzed. This requires at least specifying the customer segment and an indication of the situation in which these customers make the purchase decision.
Secondly, the customer benefit analysis specifies the various alternatives that customers consider when making their decision. At this point, it is important to include not only the direct competitors, but all the possibilities that the customer considers in his purchase decision. These could also be: “Choose other technology”, “Do it yourself”, “Postpone decision again”.
Thirdly, the customer benefit analysis shows how the customers (and not the hosts, managers, salespeople, engineers, editors, etc.) assess these alternatives in relation to each other. To do this, the cost and benefit criteria are developed and weighted. Finally, it is determined how the various alternatives perform in the individual criteria. This makes it possible to assess which choices have a strong market position and which have a weak one.
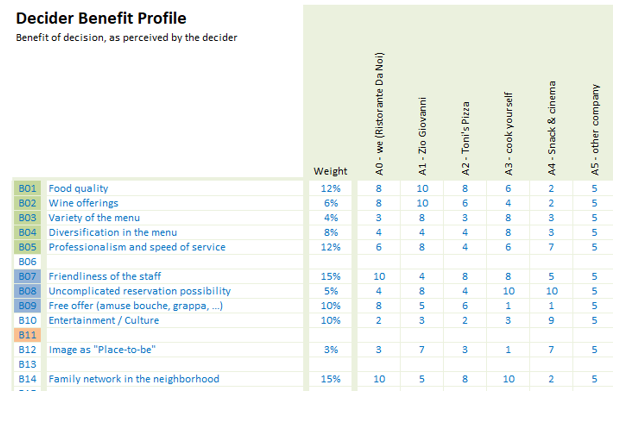
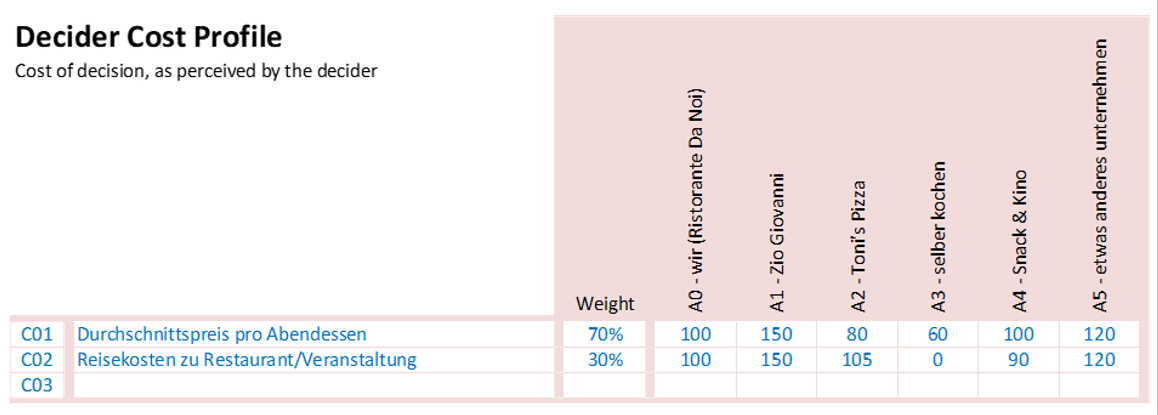
The following two tabular representations result for the restaurant example:
The Decider Benefit Profile lists the alternatives in the purchase decision in the first row. The benefit criteria are in the first column. To the right of the benefit criteria is the weighting. The matrix shows on a scale from good (10) to bad (1) how the customers rate the alternatives in the individual benefit criteria.
The Decider Cost Profile is structured in the same way. Instead of a scale of 1-10, however, an index is more practical: We cost 100, an alternative that is 50% more expensive costs 150.
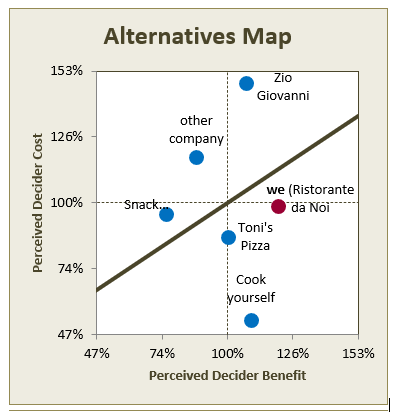
The customer benefit analysis generates different graphical representations to evaluate the collected data. The central representation is the “Alternatives Map” already illustrated in the post “Customer Benefit Analysis”. It shows at a glance which alternatives are considered, what the cost/benefit ratio of each alternative is, and which alternative has the best cost/benefit ratio – and thus the best market position.
Two other representations are the “Benefit Criteria Map” and the “Cost Criteria Map”:
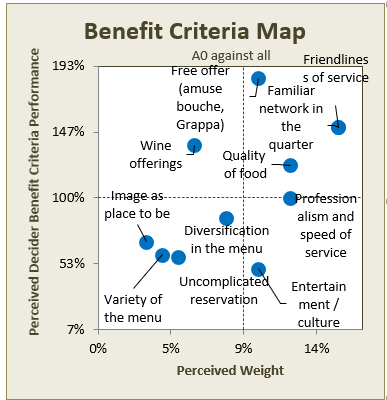
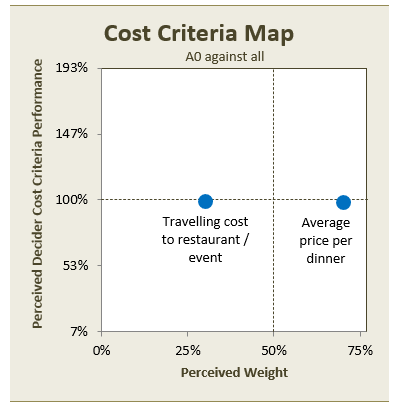
While the “Alternatives Map” shows the individual alternatives, the benefit and cost criteria are shown individually in these two maps. The horizontal axis corresponds to the weighting: Low importance for the customer (left) and high importance for the customer (right).
The vertical axis corresponds to the performance. The horizontal 100% line corresponds to the average performance in the market under consideration. If the point in the “Benefit Criteria Map” is above this line, “Ristorante da Noi” performs better in this criterion than the market average. Below the 100% line, the position of “Ristorante da Noi” in this criterion is worse than the market average. In the “Cost Criteria Map”, the situation is exactly opposite: Below the line is advantageous for the provider, above is disadvantageous.
These representations promote a focusing of the discussion on where to start to improve the market position. The quality of the wine list is above average, but not very important to the clientele. How should this be dealt with? Can the customers’ perception of its importance be changed, e.g. through appropriate advertising? This would give more leverage to the already good performance. In the “Alternatives Map”, the point of “Ristorante da Noi” would move to the right, improving the market position, respectively increasing the probability of being chosen. Could proportional costs be saved if cheaper wines of slightly lower quality were offered? The freed-up funds could then be used to improve the “Entertainment / Culture” criterion. In this criterion, the “Ristorante da Noi” is not yet so well placed, but it is important for the (potential) customers.
In terms of prices, the “Ristorante da Noi” is exactly average. There is probably not much that can be done about the travelling costs but lowering the food prices would improve the market position: In the “Alternatives Map”, the point of “Ristorante da Noi” would move down. Although the measure would reduce contribution margins, it would accelerate growth – actually the more important imperative for a new offer on the market!
Extensive details on market position and customer benefit analysis can be found in the book “Customer Orientation” by Markus Orengo.
Bibliography: Orengo, M., Kundenorientierung in Innovation, Marketing, Vertrieb, Organisation und Führung, 2. erweiterte Auflage, 2017, Verlag tredition Hamburg. If you need more information about Customer Benefit Analysis, english translation or the software tool, please mail to: markus.orengo@social-systems-engineering.ch.