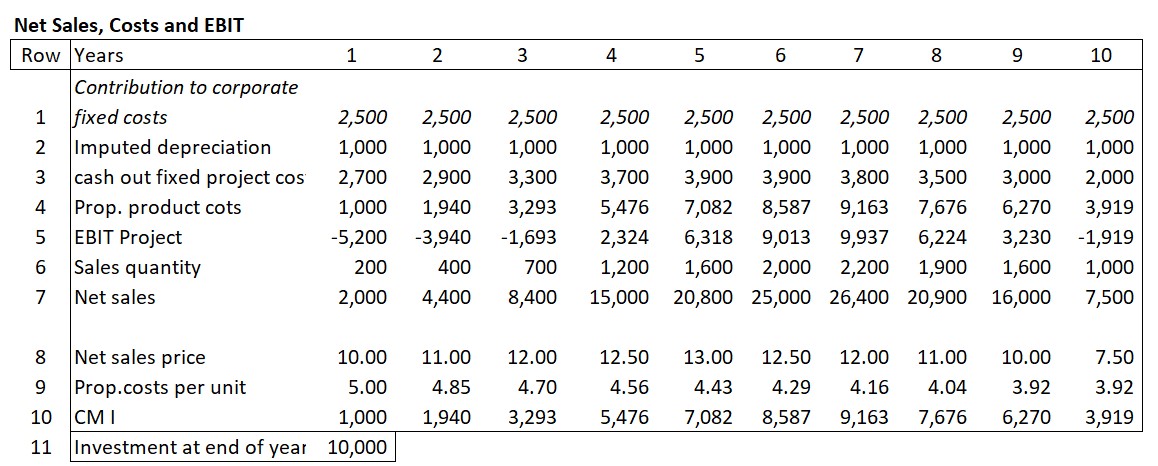
In an industrial company, the following development of sales, costs and net revenue has been observed over the course of a product life cycle:
Line 6 of the table contains the annual units sold. The net sales prices achieved can be found in line 8. The annual net sales achieved (after deduction of all sales deductions) were calculated in line 7. The proportional costs of the units sold can be found in line 4. The recalculations of the various years showed that process improvements led to a reduction in the proportional costs per unit of around 3% per year compared to the previous year.
The annual fixed project costs (cost centers) leading directly to cash outflows were summarized in line 3. The investment of 10,000 for the necessary new equipment (line 11) was amortized evenly over the 10 years of operation (1,000 p.a., line 2). The management of the company requested that the product contributes annually 2,500 to cover fixed company costs and EBIT (line 1).
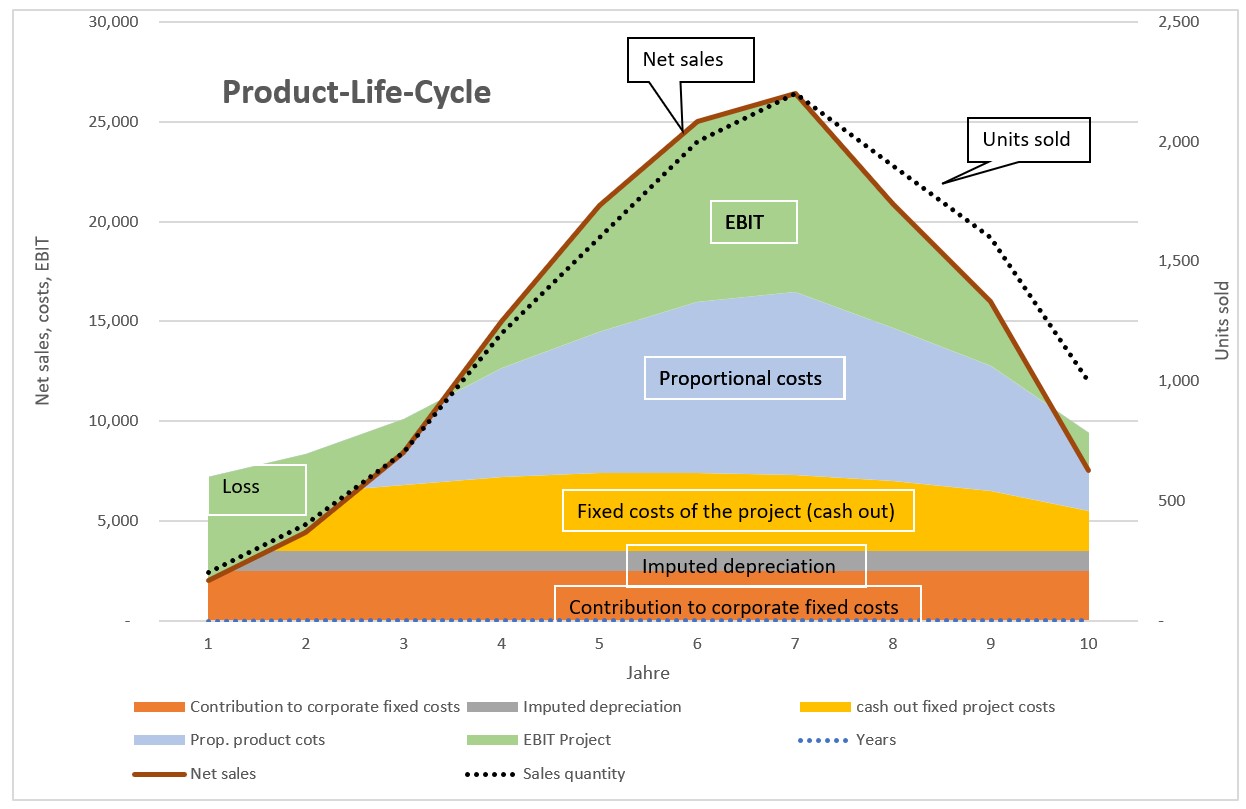
With this information line 5 shows the annual EBIT of the product. The order of lines 1 – 5 is chosen so that the fixed costs are at the bottom of the following chart and the net revenue is at the top.
The chart visualizes the development over the years. This product generated losses in years 1 to 3 and 10. However, the profits in years 4 to 9 were higher than the aforementioned losses. From year 7 onwards sales quantities and realized net sales prices fell sharply. Despite lower sales prices in years 7 to 9, profits were still generated (see line 5), as care was also taken to reduce project-related fixed costs.
Evaluating the Producct Life Cycle
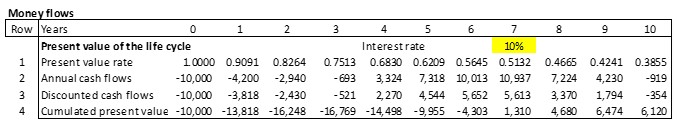
If this analysis is also prepared as a cash flow statement for the various years, it can be seen that the cumulative present value of the product life cycle only becomes positive towards the end of year 7 (line 4). The cash flows from sales at the end of the life cycle increased the present value of the strategy. This increase occurred despite lower net sales prices because the investments had already been paid for and as well the annual fixed and proportional costs were reduced.
Due to the decline in sales beginning in year 8 accounts receivable and inventories also decreased, which led to high cash flows in years 8-9 despite the slump in sales (line 2).
Cash flows in the life cycle
Dynamic capital budgeting-calculation was used to determine the net present value of the life cycle. This is particularly helpful to quantify strategic and medium-term operational plans (see the post “Dynamic Capital Budgeting“).
In the analysis below the net planned revenues are related to the expected costs of the products, the costs of the planned marketing and sales measures and the necessary investments. This is used to assess whether the entire project will be profitable and can be released for implementation.
This requires a multi-year view, because investments in fixed assets (additional machinery, capacity expansion) are to be expected and the sales volumes as well as the achievable net revenues may change in the course of the project’s life cycle. In addition, it must be taken into account that expenses and costs are incurred at times different than the net revenues. The cash inflows and outflows of the individual years must therefore be made comparable. This can be achieved with dynamic capital budgeting.
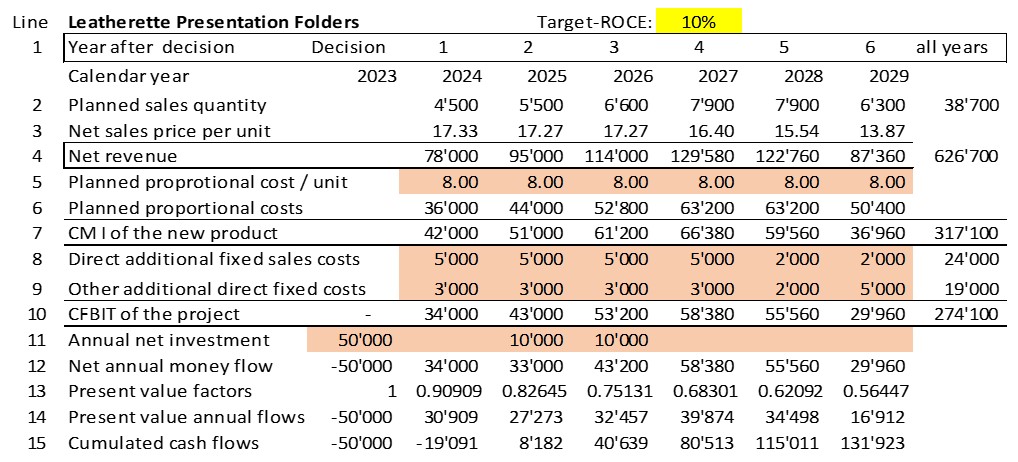
The expected annual net revenues (line 4) are taken from the table on planned sales/revenue development (cf. Costing or Pricing 1).
Since the leatherette presentation folder does not yet exist, the bill of materials and the routing for this product are still missing. As a basis for calculation, the consumption data of a product that is as similar as possible and has already been manufactured can be used. These are supplemented by the expected additional individual material items and production activities. This results in the proportional planned production costs per presentation folder (line 5). If higher purchase prices and proportional cost rates are expected in the years to plan, these cost changes can be taken into account for each planning year. For the time being proportional product costs of 8.00 per presentation folder are assumed in all years. Multiplied by the planned sales quantities (line 2), line 6 shows the annual proportional planned product costs and line 7 shows the contribution to be achieved with the presentation folders in every planned year.
Costing or pricing 2
The annually expected additional fixed costs to be ready to introduce the presentation folder and to generate the annual planned sales quantities are entered in lines 8 and 9. These can be external costs for product-specific advertising, additional costs for the creation of product catalogs, external costs for supplementing the company’s own website and additional personnel costs for the support and administration of the new products. It is important to note that only items that lead to changed cash outflows are taken into account (no allocations).
The result is the annual expected net cash return from the project, i.e. the cash flow before interest and taxes CFBIT (line 10).
The CFBIT is first used to pay for the investments resulting from the project, i.e., additional machinery, capacity expansion of existing facilities, and possibly external rent for additional premises. Higher accounts receivable balances which are expected to follow from the increase in invoiced sales must also be taken into account. If the volume of purchases from suppliers also increases as a result of the new product, the accounts payable balances will increase as a consequence. As a result, the cash outflows only occur in the subsequent period (line 11).
The balance of the annual cash outflows and inflows is shown in line 12.
This line shows that the net cash flows of the years 1 – 3 will be sufficient to cover the new investments and the changes in accounts receivable and accounts payable in years 1 – 3. The payback period of the presentation folders project is a bit more than 2 years.
However, from the point of view of the owners (shareholders) and the lenders (banks), the project should also yield a rate of return in line with the market as they consider whether they should invest their money in Ringbook Ltd. or in another company. To convince the lenders and the owners of the profitability of the project, the management of the company should therefore discount the expected future net cash flows to the moment of the project decision.
For this purpose, the present value of the nominal annual cash flows at the time of the decision should be calculated. Example:
Assuming an interest rate (i) of 10% per annum, a cash return of 1,000 that occurs exactly one year after the project decision has a value of 909.09 at the time of the decision. This results from the discounting formula:
Present value = cash flow x 1 : (1 + i)^1 = 1.000 : 0.90909.
This discounting calculation is done in lines 13 and 14 for each year. The discounted annual cash flows were added up in line 15. The cumulative present value of the project at the end of year 2 is +8,182, which means that the introduction of the leatherette presentation folders will pay for itself after only two years, even taking into account 10% interest.
You can download the generally applicable model for quantifying investments, projects and strategic plans as an Excel model here and adapt it according to your needs.
The market interest rate of 10% used here is up to date for the German-speaking world. In our book 360°-Management, pages 243 ff, we calculated and published the market-driven interest rates of various industries in different countries in 2015. In 2022, it was found that the interest rates stated there are still up to date for German-speaking countries and for the USA.
Conclusion for the financial assessment of plans and especially projects:
Pricing comes before costing: Estimating possible sales quantities and net prices and comparing them with competitor offers is a prerequisite for assessing the profitability of projects.
Separate plans must be drawn up for direct customers and sales intermediaries, as net sales revenues vary widely.
Sales deductions reduce the contribution margin in the same way as proportional product costs.
The direct costs of acquiring new customers must be included in the plan as fixed period costs.
The sales and revenue plans have to be compared with the anticipated proportional product costs of the services and products. The resulting contribution margins I must at least cover the fixed costs of the projects.
The market and the salespersons determine the sales price and the net revenues, not the costs.
Full costs per product unit can be calculated but are not relevant for decision-making because of the fixed cost breakdown.
Feed-forward and feedback are normal in the planning process. It is important to continuously take into account the resulting changes in the plans.
Multi-year horizon: The expansion or contraction of the customer base as well as the company’s own range of products and services always have long-term effects. Therefore, multi-year considerations are usually relevant for decision-making. This speaks in favor of the application of dynamic and money flow-oriented investment appraisal.
Question the assumptions, create and compare several variants of the investment calculation. This makes it possible to include the consequences of different estimates in the decision-making process.