
Function Diagram
In its conventional form, the function diagram compares a group of tasks of an organization (vertical column) with the contributions that the persons or areas involved are to make to the fulfillment of these tasks (horizontal column). In the fields of this two-dimensional representation, the contribution to be made is indicated by a letter. The letters “PDECI” can be used to enter the contributions of individual persons or departments:
P plan
D decide (on the implementation of the plan and the quality of the result)
E execute
C check (what result has been achieved?)
I inform (who receives news about what has been achieved?)
A function diagram thus replaces a lot of text that usually has to be entered and maintained in job descriptions. On one hand, this saves recording and maintenance effort in personnel administration, and on the other hand, it is possible to see in one line for each task who makes which contribution to it.
Example: Sales promotion for the product group “Filing aids”
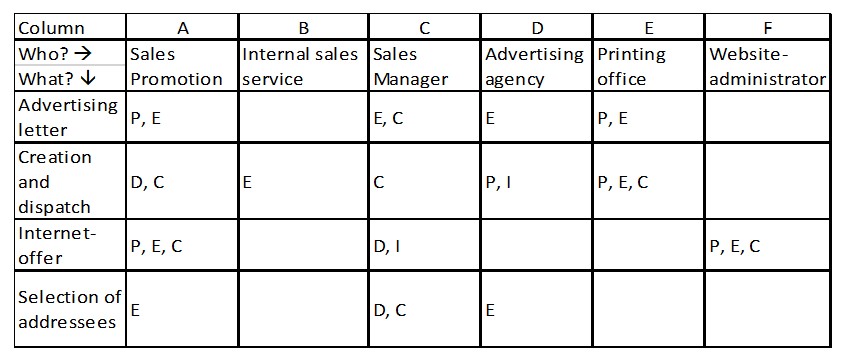
The tabular presentation can be expanded in many ways. Contributions from external companies and their employees can also be listed (columns D and E), deadlines and brief descriptions of the tasks can be attached. Likewise, the working time consumption to be planned for each individual task can be entered.
Also the strategic planning process can be supported with the function diagram. The intermediate results necessary for strategy determination and even more for strategy implementation can be described, assigned to individual persons or areas involved in the process and detailed. The (intermediate) results achieved can be documented. In additional columns planned and actual deadlines can be recorded for each task. It makes sense to also record the working hours used for this (planned and actual).
Planning and Control of Internal tasks
For products and services that can be sold or stored, the planned and actual working times are usually stored in the product-routings in the ERP-system, since they are to be linked to management accounting. The ERP also describes how the manufacturing process is to be handled.
However, this activity-related connection does not exist for the Internal tasks, since there is no direct cause-effect relationship between quantities produced or sold and time consumed for tasks such as cost center management or for handling a purchase process. To be precise we mark Internal tasks with a capital “I” because they include all work performed in cost centers that is neither directly caused by the manufactured and sold products nor requested by other cost centers according to their free will (see glossary).
It therefore makes sense to expand the function diagram into a veritable database that can be used by all employees and their bosses for planning and measuring their work. From a management point of view, a corresponding application should be able to collect and evaluate the following data:
-
- Internal tasks (catalog)
- Subtasks of an Internal task
- Planned demand in hours p.a. per Internal task
- Cost centers (where work is done, functional area assignment)
- Contribution types (PDECI) of those involved in an internal task
- Time requirement plan (recorded by cost center manager or employees)
- Employees (who is working on the task, personnel costs?
- Work performed with time and date (personal worktime recording)
- Plan to actual comparison of work done
- Service recipient (customer, cost center, project)
To use these data for planning and control, different files, which are already kept in many companies, have to be connected by a data model and a corresponding application.
Comparing planned to actual time consumption, planning for the next few years can be improved and costs of individual tasks can be calculated by reverting to payroll administration data.
The columns can be extended down to the level of the individual employee. Additional columns can be used to record deadlines per task and quantify the costs of these tasks.
In a large number of companies, the execution of Internal tasks already consumes more than 50% of the total personnel costs. Yet in our experience this cost block is rarely planned and controlled in a results-based manner. Function diagrams for Internal tasks can help to ensure that their grow less than proportionally compared to the development of sales and contribution margins. This increases competitiveness.