
Piloting in Production
Piloting in Production is neccessary because also the development in the areas of production or services requires a multi-year view. Strategic intentions often lead to the rebuilding or further development of existing processes and capacities, while operationally the focus is on improving one’s own cost position compared to the competition (produce cheaper than the competition can).
Foreseeable capacity limits
Usually it can be assumed that larger quantities will have to be produced in the next years and that the variety of the product range will become broader at the same time.
This means it is necessary to build up and maintain personnel and machine capacities and to find ways to reduce the cost per unit. In terms of capacity, several questions arise:
-
- When will plants or cost centers reach their capacity limit and require an expansion step? By comparing the monthly actual activity of a cost center to its available capacity, it becomes apparent which are the bottleneck cost centers. These could prevent the achievement of revenue and contribution margin targets.
- When will the headcount of a unit have to be increased?
- Can batch sizes be increased to reduce setup and setup-times per piece?
- How can waste be reduced, i.e. down-times shortened, yields increased and scrap reduced?
- Can transport and waiting times between processing steps be reduced?
The last two points are central elements of “Lean Production“. In order to be able to assess the intended effects also in terms of value, these effects should be mapped in management accounting. If waste is to be reduced, this must be reflected in lower proportional unit costs (material and labor) as well as in lower fixed costs of the cost centers. Lean production targets are therefore incorporated into bills of materials and workplans as standards to be achieved, and thus also into planned product costing. Reduced waste in production management leads to lower fixed cost targets in the respective cost centers.
Development of staff and its qualifications
Assuming that personnel requirements needed for production will increase in the medium term, further piloting information becomes significant for each cost center:
-
- How many employees will retire and in which years?
- How many trainees will have completed their education by then and could fill the vacancies?
- What are the personnel requirements to be recruited on the labor market for the next years?
- What training or knowledge deficits need to be addressed so that production can run as smoothly as possible?
Both in manufacturing companies and in the retail sector, scrape can be a significant waste factor. Scrapping is the result of too large purchase orders or too high production orders. It leads to additional fixed costs because:
-
- material spoils after a certain time or suffers quality losses,
- more than the dispatched quantity is produced in order to completely process the obtained material and thus not have to deliver leftovers back to the warehouse,
- the sales department hopes to be able to sell the remaining stock later and therefore asks the production department to produce more than ordered.
It is therefore advisable for production and purchasing managers to monitor the development of scrapping costs on an item-by-item basis at least annually and, if necessary, to adjust planned production.
Despite the increasing use of information technology, the workload tends to increase in the area of production planning and control and in management. Keywords are e.g.: Master data quality, more detailed planning, batch tracking, complaints processing, documentation, production data acquisition and employee support. These internal tasks should also be recorded in the production data acquisition,so that it becomes analyzable for which jobs how much working time is used for each job and how hourly requirements change over time.
Measure continuous process improvement
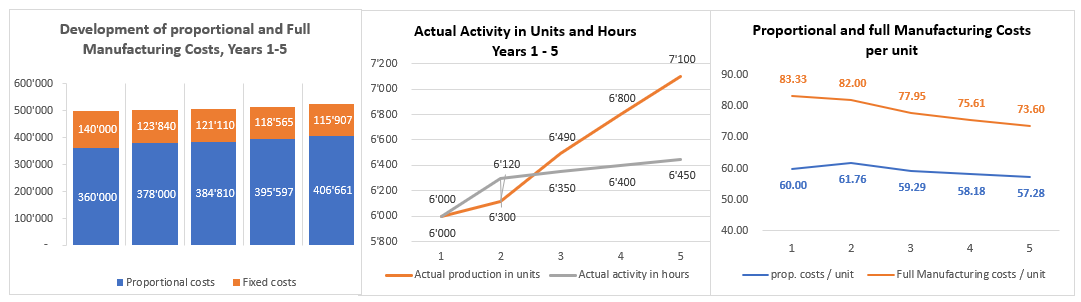
The increase in the range of products offered led to more but smaller production orders in the Stamping shop. In addition, the quantity produced increased by almost 20% over 5 years (from 6,000 to 7,100 pieces). This increase could be managed by 4 people (including the boss) without additional personnel. Although the total production costs of the cost center have increased by about 5% in these five years (wage increases), the stamping shop nevertheless produces today at a lower cost per piece.
The following factors have contributed to this:
-
- Starting in year 2 the relief of the cost center manager through the introduction of electronic production data acquisition. The time freed up allowed him to work more directly on the products.
- Shorter setup times per production order.
- Process-oriented training of the employees led to fewer errors and shorter processing times per piece.
Overall, waste was reduced to a gratifying degree (Lean) over the years. But at the end of year 5 the stamping shop is the bottleneck for production output. If sales and thus production volumes continue to rise, additional staff needs to be engaged on time.
From the graphical representation, the effects of these improvement measures can be seen when the analysis is approached in more detail:
-
- Stamping shop full unit costs increased from 500,000 to 522,586 in year 5 (+4.5%). This is due to wage increases and price increases in supplies and operating materials.
- Due to the process improvements mentioned above, the output produced increased from 6,000 units to 7,100 units, while the processing hours consumed for this purpose only increased from 6,000 to 6,450 hours. This explains why, in the graph on the right, proportional unit costs fell from 60.00 to 57.28 despite wage increases.
- Fixed costs have decreased to 115,907 due to the introduction of operational data collection and due to the efforts of the cost center manager to perform internal tasks with less workload (left graph). As a result (in purely arithmetical terms), the fixed production costs per unit fell from 23.33 to 13.60 (right graph).
By reducing fixed costs and increasing productivity in manufacturing, this cost center has made an important contribution to improving the company’s cost position. As long as market prices remain the same, the company generates higher profits. If the competition lowers selling prices, e.g. to gain market share, the company can follow and still remain in the profit zone.
Observing the piloting variables of production and their development over time reveals where internal process and structural adjustments offer opportunities to strengthen competitiveness. Therefore, piloting is an essential part of integrated operational planning and control.