
Evaluating the Product Life Cycle
In an industrial company, the following development of sales, costs and net revenue has been observed over the course of a product life cycle:
-
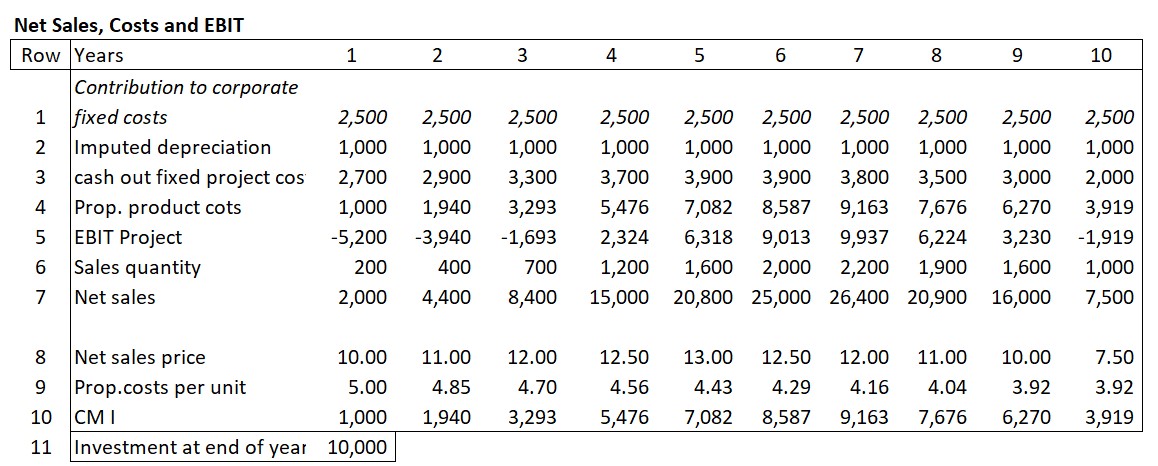
- Line 6 of the table contains the annual units sold. The net sales prices achieved can be found in line 8. The annual net sales achieved (after deduction of all sales deductions) were calculated in line 7. The proportional costs of the units sold can be found in line 4. The recalculations of the various years showed that process improvements led to a reduction in the proportional costs per unit of around 3% per year compared to the previous year.
- The annual fixed project costs (cost centers) leading directly to cash outflows were summarized in line 3. The investment of 10,000 for the necessary new equipment (line 11) was amortized evenly over the 10 years of operation (1,000 p.a., line 2). The management of the company requested that the product contributes annually 2,500 to cover fixed company costs and EBIT (line 1).
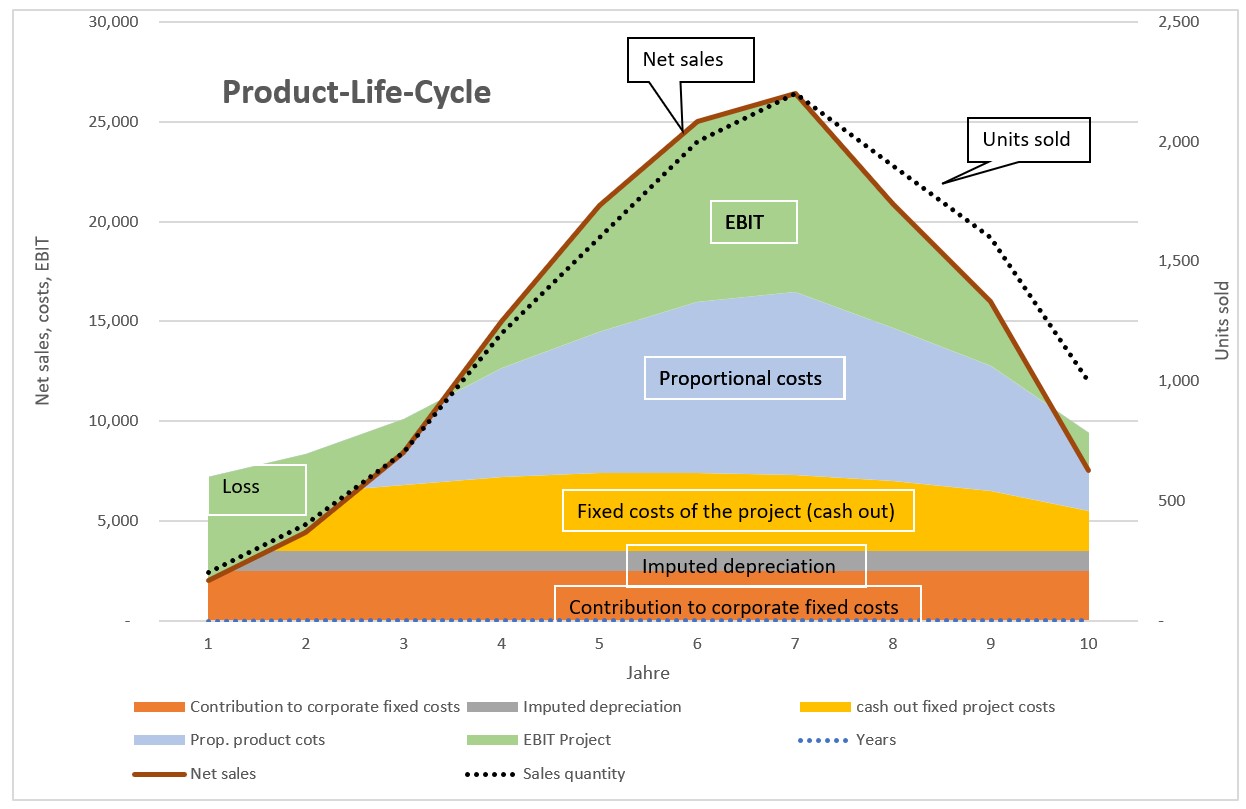
- With this information line 5 shows the annual EBIT of the product. The order of lines 1 – 5 is chosen so that the fixed costs are at the bottom of the following chart and the net revenue is at the top.
The chart visualizes the development over the years. This product generated losses in years 1 to 3 and 10. However, the profits in years 4 to 9 were higher than the aforementioned losses. From year 7 onwards, sales quantities and realized net sales prices fell sharply. Despite lower sales prices in years 7 to 9, profits were still generated (see line 5), as care was also taken to reduce project-related fixed costs.
If this analysis is also prepared as a cash flow statement for the various years, it can be seen that the cumulative present value of the product life cycle only becomes positive towards the end of year 7 (line 4). The cash flows from sales at the end of the life cycle increased the present value of the strategy. This increase occurred despite lower net sales prices because the investments had already been paid for and as well the annual fixed and proportional product costs were reduced.
Due to the decline in sales beginning in year 8 accounts receivable and inventories also decreased, which led to high cash flows in years 8-9 despite the slump in sales (line 2).
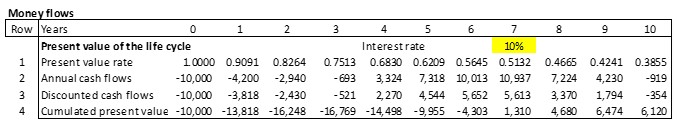
Dynamic capital budgeting-calculation was used to determine the net present value of the life cycle. This is particularly helpful to quantify strategic and medium-term operational plans (see the post “Dynamic Capital Budgeting“).