
The presentation of changes in sales over several years is the easiest way to start the analysis. The evaluation of billing data shows where to start in order to maintain previous sales successes and to generate new ones.
However, this only provides an overall view from which the causes of the changes cannot be identified. To be able to create multi-dimensional and multi-year analyses, it is necessary to ensure in the ERP system that the key variables for all dimensions to be evaluated are contained in the individual billing line. These include:
Order date, delivery date, customer, sales representative, item number, quantity, planned price, invoiced price, discounts, sales deductions.
Starting with the customer, the region, the country, the salesperson, the sales channel and often the sales agent can be detetermined. Starting from the item number, totals can be obtained by product group or assortment. If the analysis of sales is aggregated starting from the individual billing line, the change in gross and net sales as well as net revenues can be shown for all market dimensions over several years and in all aggregation levels (absolute, percentage changes, graphical representation).
If the proportional standard product costs of the product sold in the corresponding year are also deducted from the net revenue per billing line, the realized sales contribution margin is obtained for each item. This makes it possible to determine what contribution the sale of an individual item has made to covering fixed costs. In the multi-year view, it is thus possible to see how the contribution margins of individual products have changed in both the product and the customer dimension.
In the example company Ringbook Ltd., a pivot table from the ERP system is used to merge the billing data with the proportional standard product costs. Although the resulting file is very extensive, it can be evaluated according to a wide variety of criteria. The yellow fields in the extract mark the input elements to be entered, the others are linked from master files and calculations.
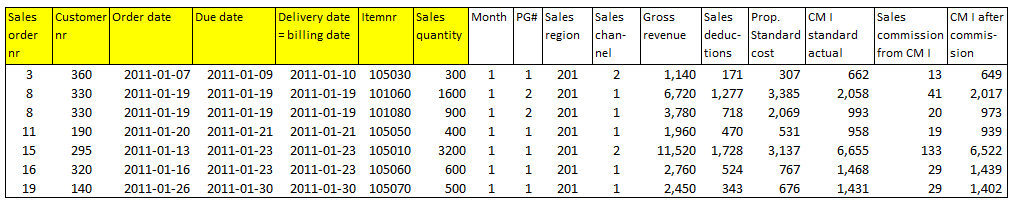
Based on this table, sales, net revenue and contribution margin analyses can be created for various time periods up to several years:
-
- Products (articles), product groups, assortments
- Customers, customer groups, sales territories, regions, sales channels
- Online shops
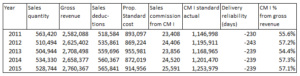
Sales Developments for Piloting
The salesperson of the sales territory East-Central Switzerland lost many stationery and office supply stores as customers in 2012 and 2013 due to business closures and sales slumps caused by major distributors and online shops. Although he gained some new customers, sales did not grow significantly. By increasingly promoting the high-margin products and by strictly adhering to the discounting rules, he has managed to increase the CM I as a percentage of gross price. This can be seen not only in the key figure CM I in % of gross sales, but also in the fact that absolute CM I has increased more strongly in percentage terms than sales from 2011 to 2015. Ringbook Ltd. does not pay commission as a percentage of sales, but as a percentage of realized CM I. Therefore, the sales representative also earned more commission.
From the analysis of the order and billing data, further signals can be gained for operational marketing and sales planning:
-
- ABC analyses by customers and products in terms of sales and contribution margin, cf. in the book Management Control System, chap. 7.2):
- Which are the 10 largest customers (cluster risk)?
- What are the C-products, i.e. those that contribute only 5 – 10% to the total contribution margin volume? These should be discontinued in favor of the A and B products because they cost more than the revenue they generate.
- Runner / sleeper analysis: Which are the 10 items with the highest sales volumes and which are the 10 with the smallest?
- Listing of lost and newly acquired customers as well as the average number of the active customers
- Repurchase rate (compare quantity and value of orders per customer over several years).
If sales and contribution margins are related to the working hours to generate them, the average CM per labor hour for salespeople, sales managers, marketing and product promotion can be determined. This metric improves especially when efficiency gains in operations have been achieved.
It is as well worthwhile to set the development of marketing, advertising and sales promotion costs in relation to the generated contribution margins of a product group, sales territory or sales channel in a time series. This provides empirical data on how long it takes for a campaign to pay off.
Strategies are indispensable for the sustainable success of a company. But learning from (sales) experience should also be continuous. The aforementioned piloting key figures serve this purpose. Only their improvement makes a strategy a success.