Only the comparison of the achieved results with the decided objectives enables the assessment of success and thus the application of the Balanced Scorecard. It is therefore necessary to check whether the data generated in the applications of the management control system can also enable the evaluations required for a BSC.
Origins of the actual BSC-data
We divide this examination into five areas:
-
- Projects
- Products
- Support processes
- Sales process
- Integration with contribution margin and profitability accounting.
Products
Process improvements are expressed by the fact that the output can be achieved with less input. This is true both in the medium-term and in the year-by-year view.
Process improvement is mainly a technical consideration: Can one product unit be produced with less material and external activity input and/or with less labor input in the cost centers, and is investment in equipment required to achieve the process improvements?
The data required for this are contained in the bills of material and in the routings of the ERP system as planned quantities and times to be achieved. The investments are recorded in the corresponding investment calculation.
In the management accounting system, the material and the consumptions of external activities are valued using standard value approaches and the work activities in the cost centers are valued using proportional planned cost rates. This results in the proportional standard cost of goods sold. All variances from the standards are shown in the final costing for each production order according to the cause of the variance (purchase price, material quantity, yield, scrap, lot size variance). The consumption variances arise in the target to actual comparison per cost center.
This description also applies analogously to directly customer-oriented service areas and to research and development areas.
In management accounting, the focus is on the target-oriented control of products, production orders and cost centers. To measure improvements in the process- and financial perspective, this actual data is condensed differently in the BSC depending on the issue. Consequently, the data used in a BSC is more highly aggregated than in management accounting.
Example: A productivity improvement target is included in the process perspective of a BSC:
The output/input ratio of a cost center is to be improved, the average costs per unit are to be reduced. Because in this cost center different products are manufactured on the same equipment, the different items must first have the same denominator. To do this, the costs of the products under consideration are divided by the quantities manufactured and the resulting value is transferred to the BSC.
However, to plan and control the improvements, the cost center manager needs data of the individual products and of the engaged cost center. This data is only available in the ERP and in the management accounting system. Additionally, he must know which costs are directly caused by the produced quantities (proportional costs) and which are the consequences of the capacity and the readiness to perform of his cost center (fixed costs). This is another reason why we recommended splitting costs into proportional and fixed when planning a cost center.
Supporting Processes
Support processes have to ensure that R+D, production and sales as well as management tasks can work properly. These tasks mainly concern the BSC perspectives of potentials and processes.
Support processes are mainly carried out in the cost centers of the functional areas:
-
- IT
- Maintenance / repairs / energy supply
- Plant management
- Purchasing / Warehouse
- Personnel administration
- Internal training and education
- Controller
- Finance / Legal Service
These areas ensure that the organization is ready to perform. In part, the service recipients (cost centers) can determine which and how much services they want to receive. This is largely the case for IT, maintenance, energy supply and workshop areas. In asset management, the purchases of buildings, machines and equipment are recorded and charged to the using cost centers on an accrual basis by means of imputed depreciation.
All other support processes are compulsory consumption from the recipient’s point of view and consequently cannot be charged to the users according to their cause (for example, software usage licenses that have to be paid for the entire company regardless of the number of users).
Insofar as services of the maintenance-, workshop-, energy- and IT-areas are the direct result of internal orders of the receiving cost centers or their performance, the proportional costs of the corresponding services can be charged to the recipients and appear there also as controllable costs. In management accounting, this requires the charging of internal services (ISP) at the proportional planned cost rate in plan and actual.
All remaining (fixed) costs in the support areas cannot be allocated to either products or customers on the basis of causation. They are to be covered by the contribution margins generated in the sales process. In the Balanced Scorecard these fixed costs of processes and potentials can partly be allocated to the perspectives but not to customers or products.
Sales process
Gross revenue from sales may be interesting for the calculation of market shares. Internally, however, and thus also with regard to their presentation in the BSC, the net revenue is relevant as this amount has to cover the total company costs and the profit. With net revenue all proportional costs of the sold units, the total fixed costs, all variances and the target profit are to be covered.
It is common that market cultivation is carried out in different dimensions. To generate sales, advertising is carried out for the entire range of products and special offers are published for various customer groups. For conversion:
-
- Salespersons are employed, who look after specified sales areas,
- Sales promotions are carried out for various product or customer groups,
- Resellers are supported in their sales channels, and
- Sales intermediaries (architects, engineers, medical doctors, journalists, scientists, and influencers in general) are coached to promote sales.
These efforts may be specific to different countries or territories and may relate to all or part of the product range offered.
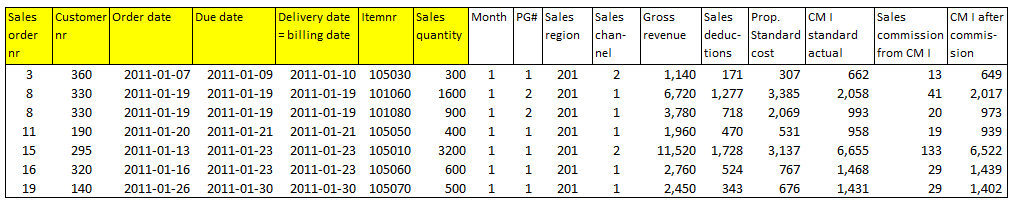
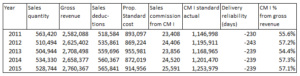
The lowest common denominator is the billing line It shows which item was sold to which customer at what gross price and at what net revenue. This means that management accounting must structure the planning and recording of sales in such a way that both the planned and the realized net revenues can be evaluated according to the dimensions listed. The evaluation dimensions relevant to management accounting thus determine which data is to be recorded when an offer is prepared or on the occasion of invoicing. This information is relevant for salespeople, product and channel managers as well as marketing and advertising managers.
Balanced scorecards can also be created for sales areas or product groups, but we mostly observe that the BSC is set up for the company as a whole. But the data base for the net revenue analysis in the BSC is created when invoices are issued to individual customers.
In order to assess the effect of sales promotion and other marketing or advertising measures, the controllable costs of these cost centers must be compared with the contribution margins generated. The costs of these measures are planned and recorded in management accounting. Care must be taken to ensure that no fixed cost allocations are built into the system. This is because the sales and marketing specialists can only be responsible for those costs that they themselves directly cause. At the BSC level, the development of the share of marketing and sales costs as a percentage of sales must be tracked if the effectivity of the use of resources is to be improved (% share of total direct marketing and sales costs, excluding allocations, in net revenue).
Many other factors decisive for sales success cannot be depicted in management accounting but are considered important in the BSC. Mainly through customer and prospect surveys, developments can be determined for the following sample topics:
-
- Shopping experience, cleanliness, appearance, user-friendliness
- Ease of use
- Delivery on time
- Accessibility and waiting queue of the hotline
- Addressing customer complaints.
Projects
Creating the prerequisites for the realization of strategies largely requires the execution of projects. Projects are initiated because several people from different areas of the company are to work together to develop new solutions to handle processes. The first difficulty is the formulation of the assignment and the definition of the results the project members should produce. The clear task must be formulated first. This also includes deadlines to be met, the determination of the project budget and the formulation of the expected results. This is the responsibility of the ordering party. To do so they need a quantitative estimate of the achievable project benefits, a schedule and the project budget as a basis for decision-making. To prepare this budget the project planner must estimate:
-
- what personnel costs will be incurred for inhouse staff and for external project staff brought in,
- which material withdrawals are to be expected from the warehouse for the company’s own tests,
- which services will be required from internal service areas (e.g. workshops, maintenance areas, production cost centers, information technology, legal services), and
- whether investments in fixed assets will be necessary for project evaluation.
These estimates add up to the project budget, which is presented for decision. The corresponding services and values are to be stored as planned values in the ERP system or in the management accounting system, similar to a production order (see the post “Project Cost Planning”).
If management decides to have the project implemented, the actual consumption of the project must also be recorded in the ERP and in management accounting for the purpose of target to actual comparison. This is because management must decide at each project milestone whether the project should be continued or terminated (go/no-go decision).
Once a project has been successfully completed and released for implementation, the resulting changes in the bills of materials, work plans and cost center plans and (fixed) asset accounting must be tracked in the annual plan so that it can be measured whether the implemented project is developing successfully and the targeted improvements are actually being achieved. These changes are also to be recorded in the ERP and in management accounting so that plan to actual comparisons are possible and efficiency improvements can be measured.