
Does your company generate a market-driven rate of return? Companies, especially SMEs (small and medium enterprises), find here the calculation basis (figures for German-speaking countries and the US). Does your company generate a profit in line with the market?
What is market-driven profit?
When investing your money in a company, you ask yourself whether this company achieves a profit in line with the market. For this to be the case, profit must correspond to the return that can be earned when investing in other companies with the same level of risk.
Consequently, a company should generate at least enough profit to cover the interest requirements of the lenders of the borrowed capital and an adequate return on capital to the owners of the equity provided. The part of the assets financed with “interest-costing capital” must earn the interest that meets the interest requirements of all capital providers. It is referred to as capital employed and results when free capital is deducted from the assets required for operations. Free capital is that part of debt which is available to the company without paying interest, i.e. debt to suppliers, advance payments from customers and non-interest-bearing provisions.
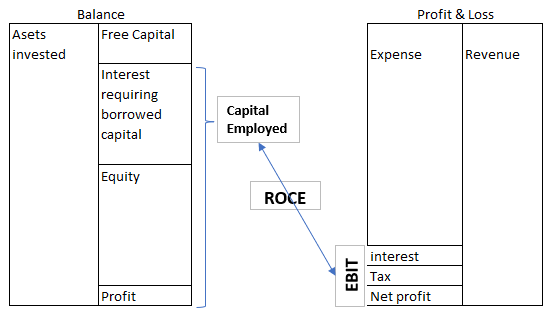
For the total capital employed, an interest rate is sought which should remain for the investors after deduction of all costs, i.e. including income taxes. This risk-based and thus market-based interest rate is referred to as the weighted average cost of capital (WACC).
Calculation of the Weighted Average Cost of Capital (WACC)
Four variables are required to determine the WACC:
-
- the cost of equity,
- the cost of debt (capital)
- the income tax rate, and
- the ratio of debt to equity (gearing).
Determining the cost of equity
From the owner’s perspective, the cost of equity represents the return (yield) he would earn if he invested his money in an alternative investment of equal risk and duration. This means that the shareholder would like to receive at least the risk-free interest rate plus a risk premium. Since equity is a long-term form of financing, the risk-free interest rate of a long-term form of investment must be applied. In practice this is often the interest rate for 10-30-year AAA-rated government bonds.
Tip: Use the risk-free interest rate from the annual KPMG Cost of Capital Study. In this study, it is given as 0.40% for 2020 and for Germany. (Internet links at the end of this post).
There will hardly be an investor who would make his money available to a company at the current risk-free interest rate of 0.40%. Since the owners share the complete risk of loss of the company, they demand a risk premium.
It is obvious that equity investors again look to the capital market to determine the risk premium rate by analyzing what return a certain broad stock index, e.g. CDAX, S&P 500, MSCI World Index, yields. The difference between the return of the chosen benchmark stock market and the risk-free rate represents the market risk premium that an average investor demands when investing in a stock.
Tip: Use the market risk premium from KPMG’s annual cost of capital study. This is given as 7.20% in the KPMG Cost of Capital Study 2020 for Germany.
The market risk premium represents the risk premium for the entire market. It is too flat for a specific company. Therefore, it has to be corrected depending on whether the company has a higher or lower risk than the average stock market. This correction factor can in turn be derived from the stock market and is called a beta factor. In practice, beta factors are calculated for different industries. The cost of equity for an average German company (beta factor = 1.00) is therefore 0.40% + 7.20% = 7.60%. For internationally operating companies, it is common to add a country risk premium to the cost of equity.
Tip: The industry beta factors can be found in the annual KPMG Cost of Capital Study. Use the “average levered beta factors by industry”. When in doubt, use the beta factor for an average company, which is 1.00. For those who want to know more, refer to our book 360°-MANAGEMENT, Appendix B (in the Bibliography), and the literature cited there.
Determining the cost of debt and the income tax rate
The cost of debt is usually the interest that the company is currently paying on long-term debt. It should be noted that the interest rates applied to borrowed capital must always be higher than the long-term risk-free interest rate plus a risk-adequate premium (spread) for the credit default risk (depending on the rating class of the company). Since interest on debt is tax-deductible and thus reduces tax expense, the cost of debt is adjusted downward by the tax rate.
According to the KPMG Cost of Capital Study 2020, the average cost of debt used for Germany was 2.20%. The average tax rate for Germany 2020 is 30.00% (KPMG Corporate Tax Rate for 2011-2021). The net after-tax cost of debt for an average German company is therefore 1.54%.
Tip: For a rough calculation, divide the total interest expense by the interest costing debt. For taxes, use the income tax rate you pay.
Determination of Debt
The final step in calculating the WACC is to determine the ratio of equity to debt. Since the market value of a company is the sum of the market value of the interest-bearing debt and the market value of the equity, the proportions must be determined at market values.
In practice, the book value of debt is usually used as the market value of interest-bearing debt. The market value of equity (shareholder value) is relatively easy to determine for listed companies by multiplying the number of shares by the stock market price.
Note: According to the KPMG Cost of Capital Study 2020, the average debt to equity-ratio used is 28.90% (w). This corresponds to an equity ratio of 77.58% (u).
Tip: For simplicity, subtract interest-bearing debt from capital employed to get the equity. The equity ratio is the ratio of equity to capital employed.
Determination of WACC and Target ROCE
Based on the previous calculations, the WACC rounded to half percentage points for an average German company is 6.00% (y). Since ROCE is calculated on the basis of EBIT and is therefore a pre-tax figure, the WACC still has to be corrected for the tax portion. The target ROCE for an average German company rounded to half percentage points is therefore 9.00%.
Note: For 2013, the author calculated an average Target ROCE of 10.00% for Germany. The target ROCE has remained relatively stable. For Switzerland, the target ROCE is 7.00% and for Austria 9.00%. The Target ROCE was in the US 7% for 2020, using the calculations of Prof. Damodaran (cf.: https://pages.stern.nyu.edu/~adamodar/New_Home_Page/data.html).
Tip: Round the WACC and Target ROCE to the nearest half percentage point and only make adjustments if the cost of capital has changed by more than one percentage point.
Was an Excess Economic Benefit achieved?
To determine the target ROCE of a specific company, the requirements of the capital market are applied to the company to be assessed. The profitability achieved by the company is compared with the risk-weighted market expectations.
The target ROCE is thus a hurdle rate, used to assess the profitability of the company as a whole in comparison with the equity market, but also serves as a yardstick for assessing strategies and investments. For this reason, the target ROCE must be an integral part of the corporate financial concept and of the top control “Profitability”.
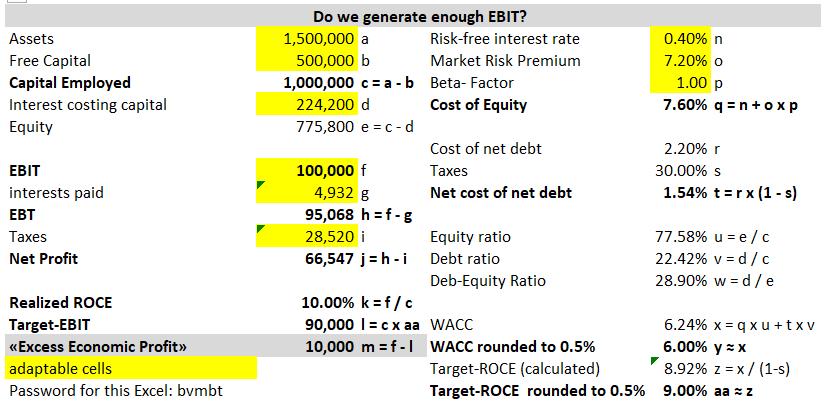
In the example, the company has achieved an EBIT of 100,000 (f). If the EBIT is divided by the capital employed (c), the realized ROCE is 10.00% (k). The company thus achieved a higher return in the last period than the 9.00% target ROCE required by the market (aa). If the target ROCE is multiplied by the capital employed (c), the target EBIT is 90,000 (l). An “Excess Economic Benefit” of 10,000 (m) was generated. This is the most important parameter for assessing management performance in terms of profitability. The ” Excess Economic Benefit” shows the increase in value of a period as an absolute amount.
Management has three decisive levers at its disposal to increase the “Excess Economic Benefit”. Firstly, to generate as high an EBIT as possible, secondly, to require as few assets as possible for this, and thirdly, to finance the assets required for operation with as much free capital as possible. A modern management accounting system supports managers in this.
Download this Excel model free of charge under “Free Downloads”. To adapt it to your own figures, please enter the password shown in the exhibit above.
The Cost of Capital Study 2020 – KPMG Germany can be downloaded here.
This post is an updated summary of Appendix B in the book 360°-MANAGEMENT (by L. Rieder and M. Berger-Vogel, see Bibliography).