Bruce Henderson and the Boston Consulting Group developed the BCG -matrix in 1970. It is intended to support strategic planning and management of companies with different products or business areas as well as different market areas. In the widely known four fields
Question Marks (question marks ?)
Stars (products with a high market share in growing markets)
Cash Cows (Dairy cows)
Poor Dogs (discontinued products)
all product or service areas of a company are entered so that the product/market portfolio can be recognized.
To determine the appropriate field in the portfolio, information on the previous course of the product life cycle (sales, cash flow, profit and growth rates) of the company’s own product or market areas is required, as well as the growth rates of the observed market. The company’s own relative market share can be estimated by comparing its own sales with total sales in the observed market.
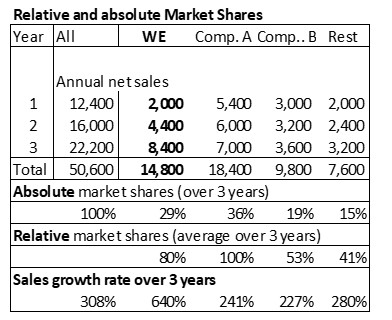
The table below shows the absolute and relative sales shares of the market participants in a product area. The data in the “We” column comes from the company’s own invoicing, while that of the main competitors A and B and the other suppliers (remainder) comes from publicly available information or estimates.
BCG-Matrix2
Compared to the largest provider A,”We” has a relative market share (average of 3 years) of 80% (14,800 / 18,400) and an absolute market share of 29% (14,800 / 50,600) compared to the total market.
Total market is growing strongly. In 3 years, sales increased from 12,400 to 50,600, i.e. by 308%. The company’s own growth rate is even higher at around 640%.
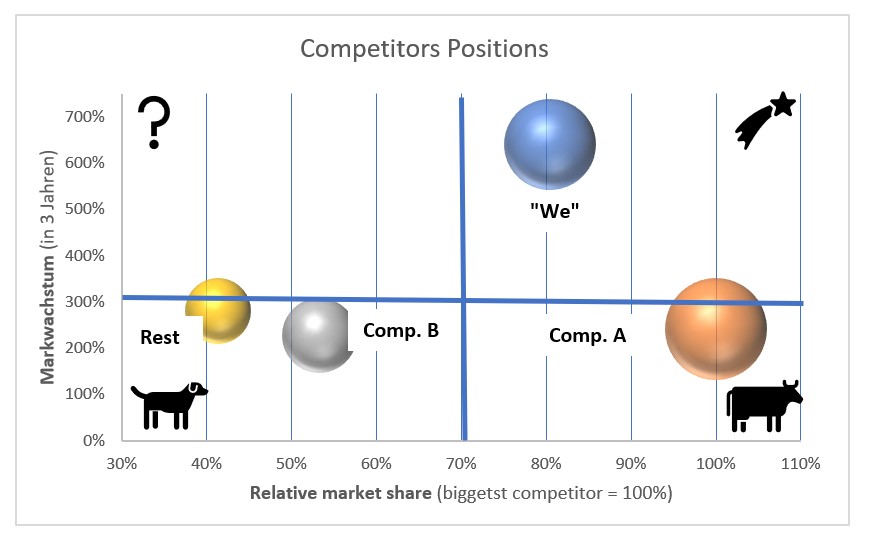
In the BCG matrix, the relative market shares are shown on the X-axis and the growth of the total market on the Y-axis. The size of the bubbles represents the sales volume of the individual providers. This allows to put the positions of the individual providers in relation to the sales leader and the competitors. For presentation the X- and Y-axes have been adjusted to the minimum and maximum values. Competitor A is (still) the sales leader. The sales of the other providers are positioned on the X-axis in relation to the market leader:
Competitor A is given the cash cow position because its sales growth is lower (247%) than that of the overall market (308%), but it still has the largest market share.
“WE” has caught up massively in terms of sales growth but is still in the “rising star” position. Sales are almost as high as those of competitor A. The reason for this is the strong sales growth of the last three years.
Competitor B’s three-year sales growth is slower than that of the other market players. As a result, its market position is slipping into the “poor dog area”.
The providers in the “Rest” group have grown slower than competitor A and “WE”. They do not seem to be able to provide potential customers with an offer that meets their needs. Their position has not improved in comparison to competitor A and “WE”. Because the “Rest” group is lagging behind in terms of sales development, it has slipped into the “Poor dogs” category.
Competitors Positions
As competitor A is already in the cash cow position, it must try to maintain sales for as long as possible, reduce or at least maintain the fixed costs of its own division and reduce proportional unit costs. This results in higher cash returns for the company, which can be used to build up new potential for success.
As long as “We” sales grow faster than those of the competitors, the business segment remains a rising star and should ensure that absolute contribution margins grow. These can be used to expand the company’s own market position or to finance new “question marks”.
“We” can use the cash released by this development to invest in question marks and to finance the growth of the stars.
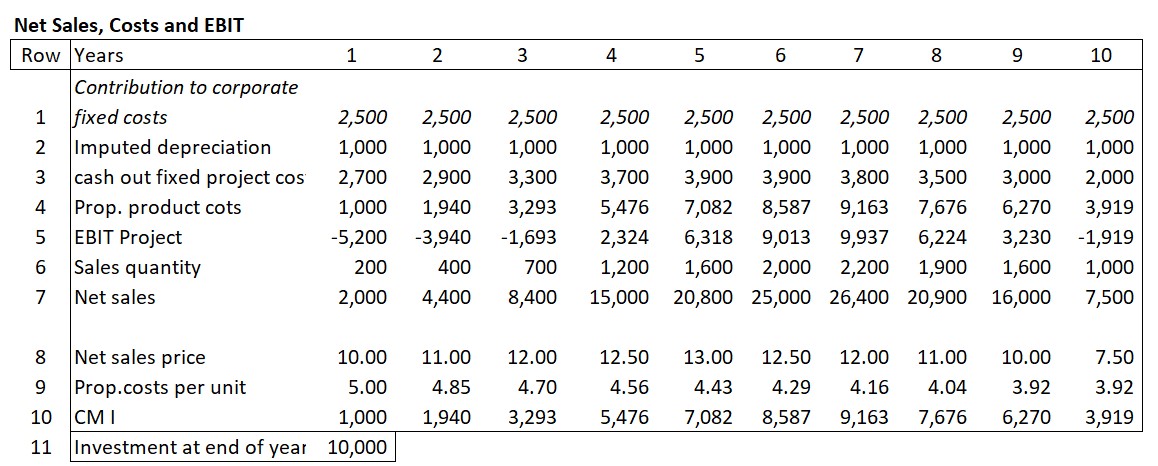
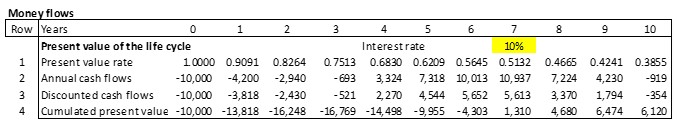
In an industrial company, the following development of sales, costs and net revenue has been observed over the course of a product life cycle:
Line 6 of the table contains the annual units sold. The net sales prices achieved can be found in line 8. The annual net sales achieved (after deduction of all sales deductions) were calculated in line 7. The proportional costs of the units sold can be found in line 4. The recalculations of the various years showed that process improvements led to a reduction in the proportional costs per unit of around 3% per year compared to the previous year.
The annual fixed project costs (cost centers) leading directly to cash outflows were summarized in line 3. The investment of 10,000 for the necessary new equipment (line 11) was amortized evenly over the 10 years of operation (1,000 p.a., line 2). The management of the company requested that the product contributes annually 2,500 to cover fixed company costs and EBIT (line 1).
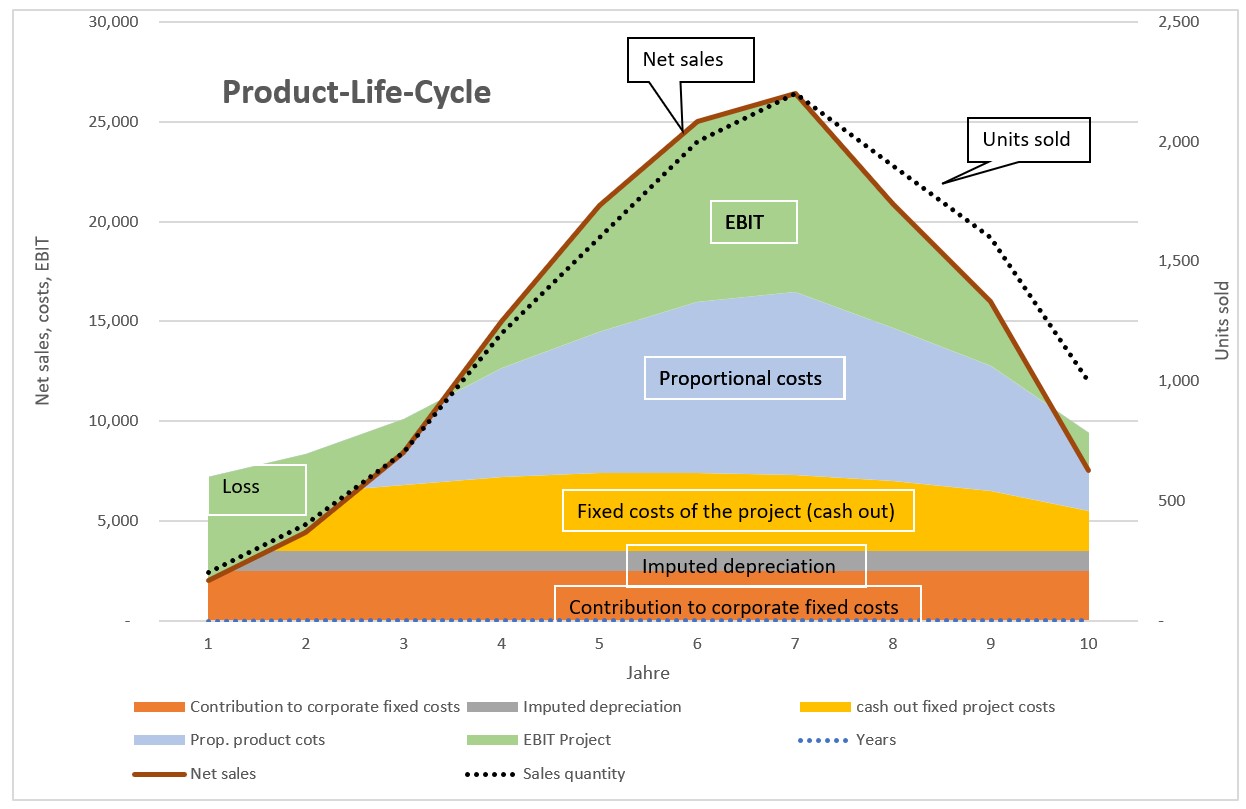
With this information line 5 shows the annual EBIT of the product. The order of lines 1 – 5 is chosen so that the fixed costs are at the bottom of the following chart and the net revenue is at the top.
The chart visualizes the development over the years. This product generated losses in years 1 to 3 and 10. However, the profits in years 4 to 9 were higher than the aforementioned losses. From year 7 onwards, sales quantities and realized net sales prices fell sharply. Despite lower sales prices in years 7 to 9, profits were still generated (see line 5), as care was also taken to reduce project-related fixed costs.
Evaluating the Producct Life Cycle
If this analysis is also prepared as a cash flow statement for the various years, it can be seen that the cumulative present value of the product life cycle only becomes positive towards the end of year 7 (line 4). The cash flows from sales at the end of the life cycle increased the present value of the strategy. This increase occurred despite lower net sales prices because the investments had already been paid for and as well the annual fixed and proportional product costs were reduced.
Due to the decline in sales beginning in year 8 accounts receivable and inventories also decreased, which led to high cash flows in years 8-9 despite the slump in sales (line 2).
Cash flows in the life cycle
Dynamic capital budgeting-calculation was used to determine the net present value of the life cycle. This is particularly helpful to quantify strategic and medium-term operational plans (see the post “Dynamic Capital Budgeting“).
Different task owners of a company have to work together if an offer is to be prepared for a product (or service) manufactured exactly according to customer specifications:
Sales (direct customer advisor)
development, possibly research (feasibility)
Challenging production (cost) points (personnel and machine capacities), available capacity reserves
Purchasing (procurement of critical materials, transportation costs to the customer)
Controller (standard costing of the product or service, contribution margin targets)
The challenge for the company making the offer is, on the one hand, to have all internal data available for the potential business and, on the other hand, to be able to respond to the customer inquiry on time.
This requires being able to plan the potential order and also check the availability of personnel and machine capacities. It is also necessary to determine whether the raw material can be procured on time and whether any required semi-finished products will be available in inventory.
Plan and calculate the order in PPS before submitting the offer
For a customer-specific quotation, it is advisable to first enter the production order as a test in the PPS and to create a precalculation in management accounting. This is to clarify in advance whether the personnel and machine capacities will be available and whether the offer will generate sufficient contribution margin. PPS and precalculation are a central prerequisite for to quickly respond to customer inquiries. It must be possible to immediately retrieve or process all key influencing factors from the existing information system:
Customer data (address, contact person, order quantities, desired delivery dates, possibly qualitative specifications)
Market data (competing suppliers and their strengths)
Article data (search for and adapt articles with similar bill of material)
Work plan (processing steps and times per cost center/production center, setup, scrap rate, special tools if necessary)
Availability of raw materials and semi-finished products (availability, replenishment time)
Delivery times from suppliers
Planned capacity utilization of production facilities, next free availabilities (can also refer to development), especially important if short and long production orders run on the same production facilities
Proportional planned costs per unit for the requested product
Contribution margin targets for the product or potential order
Execution locks due to unpaid invoices (accounts receivable)
New tools to be manufactured for the order, their delivery date and costs.
As this is an offer for a service not yet provided in this form or a customer-specific product, the data mentioned is required to create a preliminary cost estimate and determine the possible delivery date. A large part of the data and processing structures are already stored in the ERP. Access to the current ERP data is also important because other orders are implemented during the processing time of the offern and the free production capacities change as a result.
Quick Response Teams
In order to win the customer or the order, the offer must be submitted quickly. After all, the customer is waiting for the proposal so that he can also supply his own customers on time and as required.
To shorten the lead time when preparing an offer, it is suggested that “quick response teams” be set up (Daniel Moser, Wertfabrik). The team members should report directly to the team leader and have complete read and evaluation access to the above-mentioned databases. They work cross-functionally and, if the ERP-system and the management accounting-system are up to date, they can avoid or at least speed up coordination, calculate the offer and determine schedule availabilities. If quick response teams are to be formed in companies that receive inquiries from different customer groups or application areas, it may be advisable to set up several QR-teams.
As the capacity for core products is often used by several areas, the QR-teams’ read-only access to the company’s entire capacity requirements planning is particularly important.
Reducing lead times also has an impact on the financial result:
Less money is invested in the warehouses and, above all, in the average “work in progress” inventory. This reduces interest costs and the need for equity. As few orders in progress as possible should have to wait for the next processing step.
Faster invoicing also leads to less need for credit and therefore lower interest costs.
The most important factor, however, is that the customer receives an offer sooner without false promises.
A hairdresser will tell you when he has the next available opening and whether he can offer the service you want.
Similarly, many service or production companies receive inquiries as to whether they can render a service or manufacture a product according to the customer’s specifications. The customer wants to know how quickly the specific product or service can be delivered, in what quantity and at what net price.
The offering company assumes that it can deliver the product or service. Even if the product or service is already being manufactured and sold in a similar form today, it is a make-to-order manufacture.
This raises the following questions for the bidding company:
Are we able to produce this?
Can we meet the desired deadline?
What order quantities and delivery conditions are required?
Can we expect follow-up orders if we will be successful?
Are there competing suppliers and at which prices do they quote?
Is the production capacity needed available in terms of personnel and machinery, or can it be built up within a reasonable period of time?
Can the required raw materials and semi-finished goods be procured in sufficient quantities and within a reasonable period of time?
How much net revenue and contribution margin would have to be generated to achieve the own planned profit targets?
To avoid unpleasant surprises these questions must be answered internally before an offer is submitted to the potential customer.
Since the potential customer formulates fairly precise requirements and quickly expects a reliable offer, the offering company must design its planning and control system to be able to prepare offers, process orders and manage its own earnings development. These are the subjects of the next posts.
For service providers, material consumption and machine capacity are rarely the key bottlenecks. Mostly the available hours for order-related work limit the achievement of a profit in line with the market.
Activity- and cost-planning for an ERP- implementation
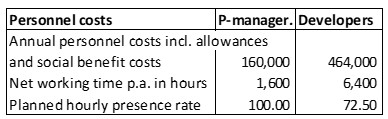
A small IT company implements ERP-systems for its customers and also programs software enhancements as needed. The customers are in each case supported by a project manager. The developers perform the implementation work and also create program adaptations if required. For the plan year, the personnel costs of the project manager and the four developers are as follows:
Personnel costs of IT-department
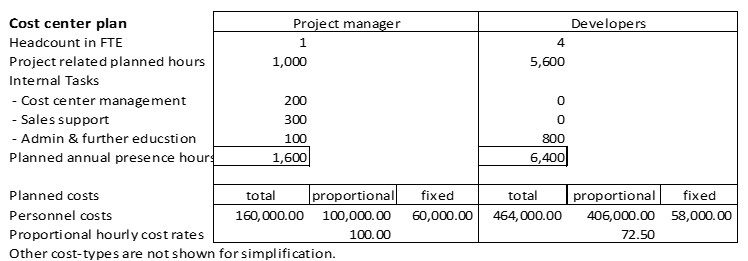
The following simplified cost center plans resulted from annual planning:
If the hours scheduled for Internal tasks (cost center management, sale support, training and internal administration) are deducted, 1,000 hours remain during which the project manager can work on customer orders. The developers plan to work 5,600 hours on projects.
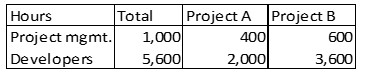
According to project planning, the following hourly employments are foreseen for 2 projects in the planned year (in hours):
The order-related planned hours can be performed for both projects.
Planned contribution margins
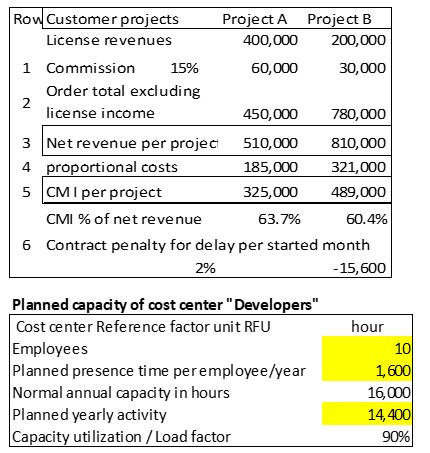
The supplier of the standard ERP software grants the installing IT company a commission of 15% of the license revenue invoiced to the end customers (line 1). The contracts with the two end customers include the agreed project manager hours at 250.00 per hour and the developer hours at 175.00 per hour. For each project, this results in the contract total excluding license revenue (line 2). Line 3 contains the net revenues per project.
The planned proportional production costs per order were calculated by multiplying the proportional planned hourly rates of the cost centers with the planned hourly consumption (line 4 below). This results in the CM I to be achieved per project.
CM I per Project
To ensure that Project B is fully operational on schedule, i.e. by the end of the planned year, the client insisted that a penalty of 2% of the contract sum (line 6) bededucted from the agreed contract sum per month of late completion.
Personnel bottleneck
On June 30 of the year, one of the developers terminates his employment contract as of September 30 because he wants to continue his education.
As a result 400 developer hours will be missing in the fourth quarter. Both projects should be completed by the end of the year. The search for a new developer has been unsuccessful so far.
The project manager consults with sales management. Two solutions are outlined:
Complete project B only by the end of January of the following year. This would trigger the penalty of 15,600.
Convince the client of project A that his project will not be completed until the end of January of the following year. For this delay, he would receive a subsequent discount of 25,000.
In purely arithmetical terms, the difference of 9,400 between 1. and 2. argues in favor of completing Project A on schedule at the end of the year and to pay the contract penalty for Project B. If, on the other hand, Project B were not completed until the end of February or even later due to further delays, a further 15,600 penalty would have to be paid each month, which would mean that the one-off discount for Project A would have less impact on the result.
In the real case, other factors not considered in this example calculation would have to be taken into account, e.g. effects on customer satisfaction, adherence to schedules, follow-up orders and the reputation of the IT company.
Cost splitting in service companies too
The example is intended to show that the splitting of cost center costs into their proportional and fixed parts is also relevant to decision-making in the planning and management of service companies. Only if it is known which costs are directly caused by a certain service, it is possible to distinguish which costs are caused by the service units provided and which are the fixed period-dependent service-readiness costs.
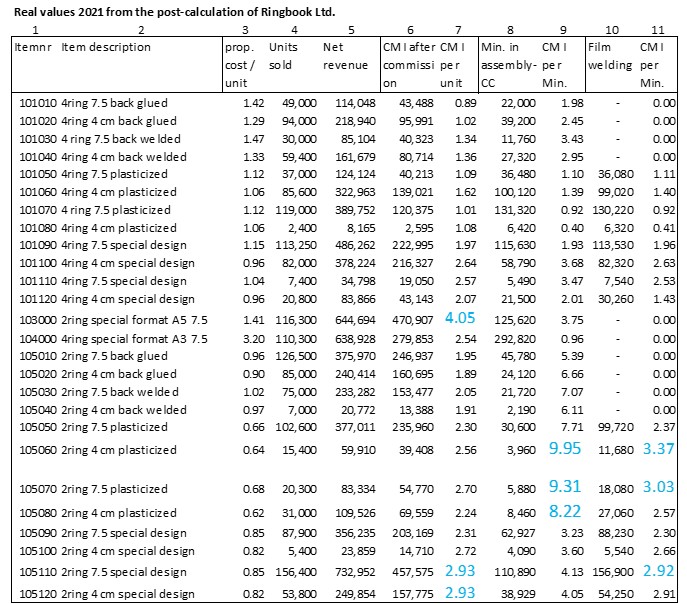
The table below shows how much contribution margin I per bottleneck unit is generated by the individual products of Ringbook Ltd. The data basis are the actual values of the year 2021 (sales volumes, realized net revenues, recalculated proportional manufacturing costs, actual employment in the assembly and foil welding cost centers). In each case, the best three items are marked in blue.
Column 7 shows that item 103000 achieves the largest contribution margin per unit (4.05). This is followed by articles 105110 and 105120. It is therefore worthwhile for the salespersons and for the company to concentrate primarily on these three products. 4.56 units of item 101010 must be sold to generate the same contribution margin for fixed cost coverage as one unit of 103000. The market potential of the standard item 101010 (first line) is naturally much greater than that of item 103000 (special A5 format with wide back). The sales staff of Ringbook Ltd. recognized this and therefore exploited the market potential of article 103000 better than the competition, with 116,300 units sold.
The dominating bottleneck
Final assembly of the ring binders takes place in cost center 250 (Assembly). Column 9 shows that the articles 105060, 105070, 105080 achieve the highest contribution margins per minute of assembly time. If assembly becomes a bottleneck due to machine failure or insufficient personnel, the articles mentioned are consequently to be produced first.
If the available output in the foil welding shop becomes a bottleneck, this only affects the foil-wrapped articles. Of these, articles 105060, 105070 and 105110 are to be produced first, as they achieve the highest CM I per minute of bottleneck utilization.
Since the material consumption for sheet steel and wire is more than twice as large for 4-ring binders as for 2-ring binders, in the event of a supply bottleneck for these raw materials, the achievable CM I per piece would have to be related to the individual material costs per piece (not shown here).
Prerequisites for bottleneck analyses are on the one hand, the existence of the bills of material and the routings of the products to be manufactured. On the other hand the split into proportional and fixed costs must be set up in cost center planning. This is because to make optimum use of the remaining capacity in a bottleneck, it must be known which articles generate how much CM I per dominant bottleneck unit. For this calculation, the split into proportional and fixed costs is necessary in the cost centers so that the proportional product- and manufacturing costs can be determined.
Throughput
Typically, order intake is the dominant bottleneck. Customer demand and the skills of the sales force determine net revenue and contribution margin. When internal bottlenecks occur, the aim is to keep throughput as high as possible until they are eliminated. This would argue for selling and manufacturing primarily those products that make the least use of the bottleneck. However, the numerical example above showed that from the overall perspective of the company, contribution margin I must be maximized in order to cover the fixed costs and the target profit.
Therefore, it is important to sell first those products or services that achieve the highest CM I per bottleneck unit.
Inventory levels are not relevant to the decision-making process in terms of throughput. This is because the dominant bottleneck area must be continuously supplied with the raw materials and semi-finished products needed to operate at full capacity at all times. When and how much of an article is to be purchased is determined by the replenishment lead times, the delivery capabilities of the suppliers and their price conditions. In addition, there are safety stocks so that the cost centers can continue to produce if delivery is delayed for other reasons. Many manufacturing companies therefore try to agree “just-in-time” delivery with suppliers. This way, they oblige the suppliers to stock enough units in their own company.
Various reasons can lead to the fact that products and services manufactured or refined in-house cannot be delivered according to customer requirements, i.e. in line with incoming orders.
The possible causes are manifold:
Insufficient inventory of finished or semi-finished products
Lack of raw materials or late deliveries from suppliers
Energy or other operating material deficiencies
Failure of machines or tools
Insufficient personnel capacities in production cost centers
Delayed final quality inspections of manufactured items
Insufficient production capacities of certain facilities
In such situations, it is important to identify the respective bottlenecks and to master them in such a way that the available capacities are used optimally until the bottleneck is eliminated. This optimal utilization occurs when the maximum possible contribution margin I is generated, taking into account the dominant bottleneck in each case. Because, as has been shown several times in this blog, the contribution margins generated are used to cover fixed costs and profit.
Cost center planning
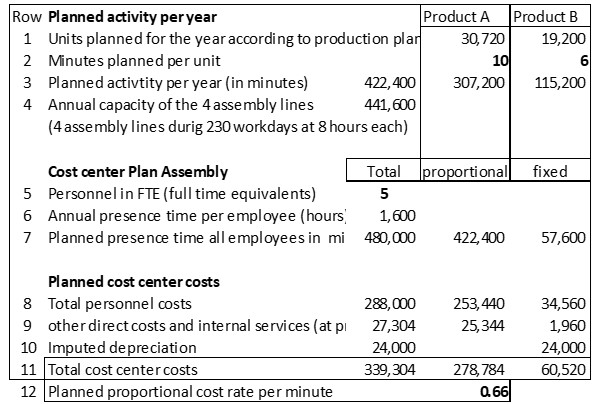
In the example company Ringbook Ltd. the sleeves and closing mechanisms are joined together to ring binders ready for sale in the assembly cost center. For this purpose 4 parallel assembly lines are available. Each of these lines is in operation for 8 hours per working day. With 230 annual working days, the capacity of each line is 230 * 8 * 60 minutes = 110,400 minutes. Together all four assembly lines have an annual capacity of 441,600 minutes.
Production management planned an annual activity of the assembly area of 422’400 minutes (see lines 1 – 3). The capacity of 441,600 minutes should therefore be sufficient for the planned production. For each piece of ring binder produced, an employee in the assembly department works 1 minute. 57,600 minutes are planned per year for organization, cleaning, maintenance and training (lines 6 and 7). In total, the presence time of the five employees (including cost center managers) amounts to 480,000 minutes. After taking into account the other direct costs, the costs directly caused by the products amount to 278,784 in line 11 in the “proportional” column and the proportional planned cost rate of 0.66 per minute in line 12.
Costcenter plan “Assembly”
Product costing and contribution margins
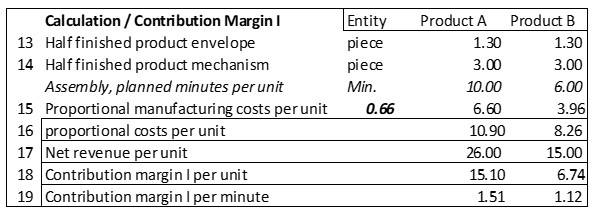
In lines 13 – 19, the product costing and contribution margin calculation can be traced. Product A requires 10 minutes per piece in the assembly line, product B 6 minutes. Together with the costs for the envelope and for the binder mechanism, the proportional costs per unit result in line 16. In line 18, the contribution margins per unit are calculated.
Contribution margin per unit
Machine breakdown in assembly
One of the four assembly lines suffers a machine breakdown. The supplier reports that four months !! will pass until the necessary spare parts will be delivered and the plant will be ready for operation again. As a result, one third of the capacity of one of the four lines is missing, namely 36,800 machine minutes (cf. line 4: 441,600 / 4 / 12 x 4). These are no longer available for assembly.
The production manager wants to reduce the production of product A because each unit of A requires 10 minutes of production time, whereas for product B it is only 6 minutes per unit (line 2). The sales manager replies in the management meeting that the contribution margins of the products must be considered before the production program is determined. Who is on the right track?
Line 19 gives the answer. Product A generates a CM I per piece of 15.10. Per minute of bottleneck usage (cost center assembly) this is 1.51. Product B uses the bottleneck less, but because of the lower sales price “only” generates a CM I of 1.12 per minute.
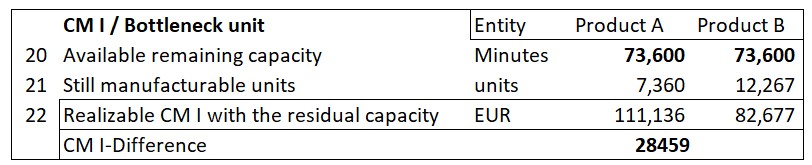
CMI per bottleneck unit
If the remaining capacity of 73,600 minutes (line 20) were used exclusively for product A, a CM I of 111,136 could be generated, while concentrating on product B would generate 82,677 (line 22). This is, of course, a hypothetical calculation, since what has to be produced is what the customers buy. However, the difference of 28,459 CM I between the two products shows that concentrating on the products that are stronger in terms of the bottleneck leads to a higher total CM I and thus to a better company result.
This example intends to show that in operational management it is necessary to analyze in each case how a bottleneck affects the overall result, e.g. earnings before interest and taxes (EBIT). For this purpose, the CM I per bottleneck unit must be calculated. Bottlenecks can be raw materials that are difficult to procure, insufficient service availability from suppliers, own personnel capacities or the availability of own equipment.
If the activity level decreases, but the personnel cannot be used in other cost centers or cannot be committed to a lower degree of employment, the fixed costs, resp. the spending variances of the considered cost center increase. To avoid this is the task of the cost center manager concerned.
SWOT analysis is intended to produce a structured representation of the strengths and weaknesses of the organization under consideration and to contrast these with the opportunities and threats in the four environmental spheres (cf. the post “Environmental Changes are Crucial for Management Control“).
The purpose of the opportunities/risks and strengths/weaknesses assessment is to,
create the basis for strategic planning and
define the success potentials necessary for their realization.
A SWOT analysis is primarily prepared by the top management of an organization. They determine whereto the company / organization should develop and assess whether the targeted development will be feasible in the medium-term time horizon. The decisions derived from a SWOT analysis form the planning template for the strategic and operational planning executives.
Subordinate management levels should be able to derive which services and products the company should use to achieve strong positions in nominated markets and which results should be achieved in the process (corporate policy determinations).
The assessment and documentation of external opportunities and risks and the evaluation of the company’s own strengths and weaknesses form the input for strategic and medium-term planning.
Analysis of the environment and of the own position
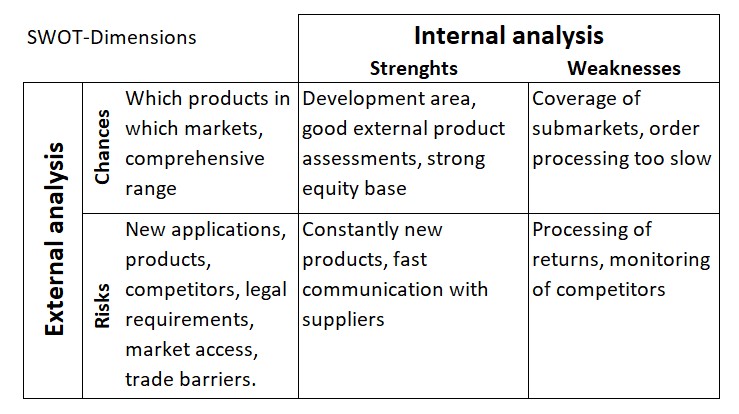
The widely known SWOT matrix shows the initial questions of the analysis:
Business environment: In which environmental areas are opportunities for new products and services suspected and which threats could prevent success?
Own development direction: In which product/market combinations does the company see its strengths for expanding its market position, and which of its own weaknesses could prevent success?
SWOT Analysis
The above questions on opportunities and risks are examples. The same applies to the assessments of the strengths and weaknesses of the own company.
If a company’s management creates its own SWOT analysis and records its findings in the matrix, the subsequent management levels can align their strategic plans and, above all, the development of future success potentials accordingly.
How the strategic and medium-term plans for the entire company are derived from the SWOT analysis is the subject of the following posts:
CZSG Controller Zentrum St. Gallen/Switzerland introduced many decision-relevant planning and control systems mainly in German speaking countries. The basis was always “Grenzplankostenrechnung GPK” and the further developments arising from it. The applied management accounting principles correspond almost 100% to the recommendations for the design of “Resource Consumption Accounting RCA” according to Larry R. White and of the Profitability Analytics Center of Excellence PACE.
Who decides what?
Many chief financial officers and cost accountants see the purpose of management accounting primarily as presenting an organization’s financial results in accordance with the requirements of local accounting laws, IFRS and USGAAP, local tax laws and regulations for setting transfer prices between related companies, and other regulations.
In our eyes the purpose of management accounting is first and foremost to provide decision support for managers at all hierarchical levels. After all, they are responsible for the results to their superiors. The focus is on management support, not on external reporting.
Customers decide whether they want to place an order and at what price. In this way, they also indirectly decide the proportional manufacturing costs of the products or services to be sold and manufactured. Managers at all levels decide how the necessary offers are to be made and what personnel and machine capacities will be required to process the orders won and, in doing so, to achieve a profit with the company in line with the complete market.
In strategic and operational planning, managers at all levels must define activities, quantities and capacities. Consequently, consumption according to bills of materials and work plans as well as activity-based cost center budgets are required for planning and subsequent control. Only when these quantities and activities are known can they be valued in monetary terms. A management accounting system that is suitable for decision-making must therefore provide those quantities, activities and valuations which a responsible manager can control himself and thus take responsibility for. This also requires that the manager can always compare the planned values with the actual values of his area.
This starting position applies to manufacturing companies, service providers, hospitals, retailers as well as banks and government institutions.
No financial accounting system can provide this data, as it only represents values. Valuation regulations from tax law, from accounting standards (US GAAP, IFRS) or from specifications for the determination of international transfer prices are also irrelevant in accounting for management, because cost center managers, product managers and salespersons cannot change these values themselves.
Responsibilities of different managers
(usual period of consideration is one month).
Since managers are responsible for achieving their objectives, it is useful to list their responsibilities.
Production manager:
Timely processing of dispatched production orders
Ensuring stock receipts of semi-finished and finished products (valued at proportional standard production costs)
Adherence to target consumption rates for materials and cost center activities in accordance with the precalculation of released production orders, valuation of consumption at planned purchase prices and proportional planned cost rates
Compliance with the planned costs of its own cost center(s)
Notify other areas when capacity constraints become apparent.
Cost Center Manager:
On-time completion of manufactured work
Adherence to the precalculated times in the production orders to be processed
Adherence to target costs (flexible budget) of own cost center, taking into account precalculated times and work performed.
Sales Manager:
Achievement of planned net revenues per period (invoiced).
Compliance with the planned costs of his own cost center(s)
Meeting the agreed delivery dates to the customers.
Purchasing Manager:
Procurement and on-time availability of all goods and services to be purchased.
Determination of planned prices (standard prices) for raw and auxiliary materials as well as services to be purchased (on this basis the standard cost calculations are prepared)
Informing sales and production in the event of major variances between actual and planned purchase prices.
Who is responsible for depreciation?
The manager in whose cost center the asset is located,
the managers who determined the planned useful life of an asset on the occasion of the investment decision,
the financial manager or the controller who determines the depreciation method (preferably fixed depreciation from the replacement value of an equally efficient asset)
Depreciation is mainly a period cost, since most assets do not need to be replaced because they no longer function, but because they are technologically obsolete.
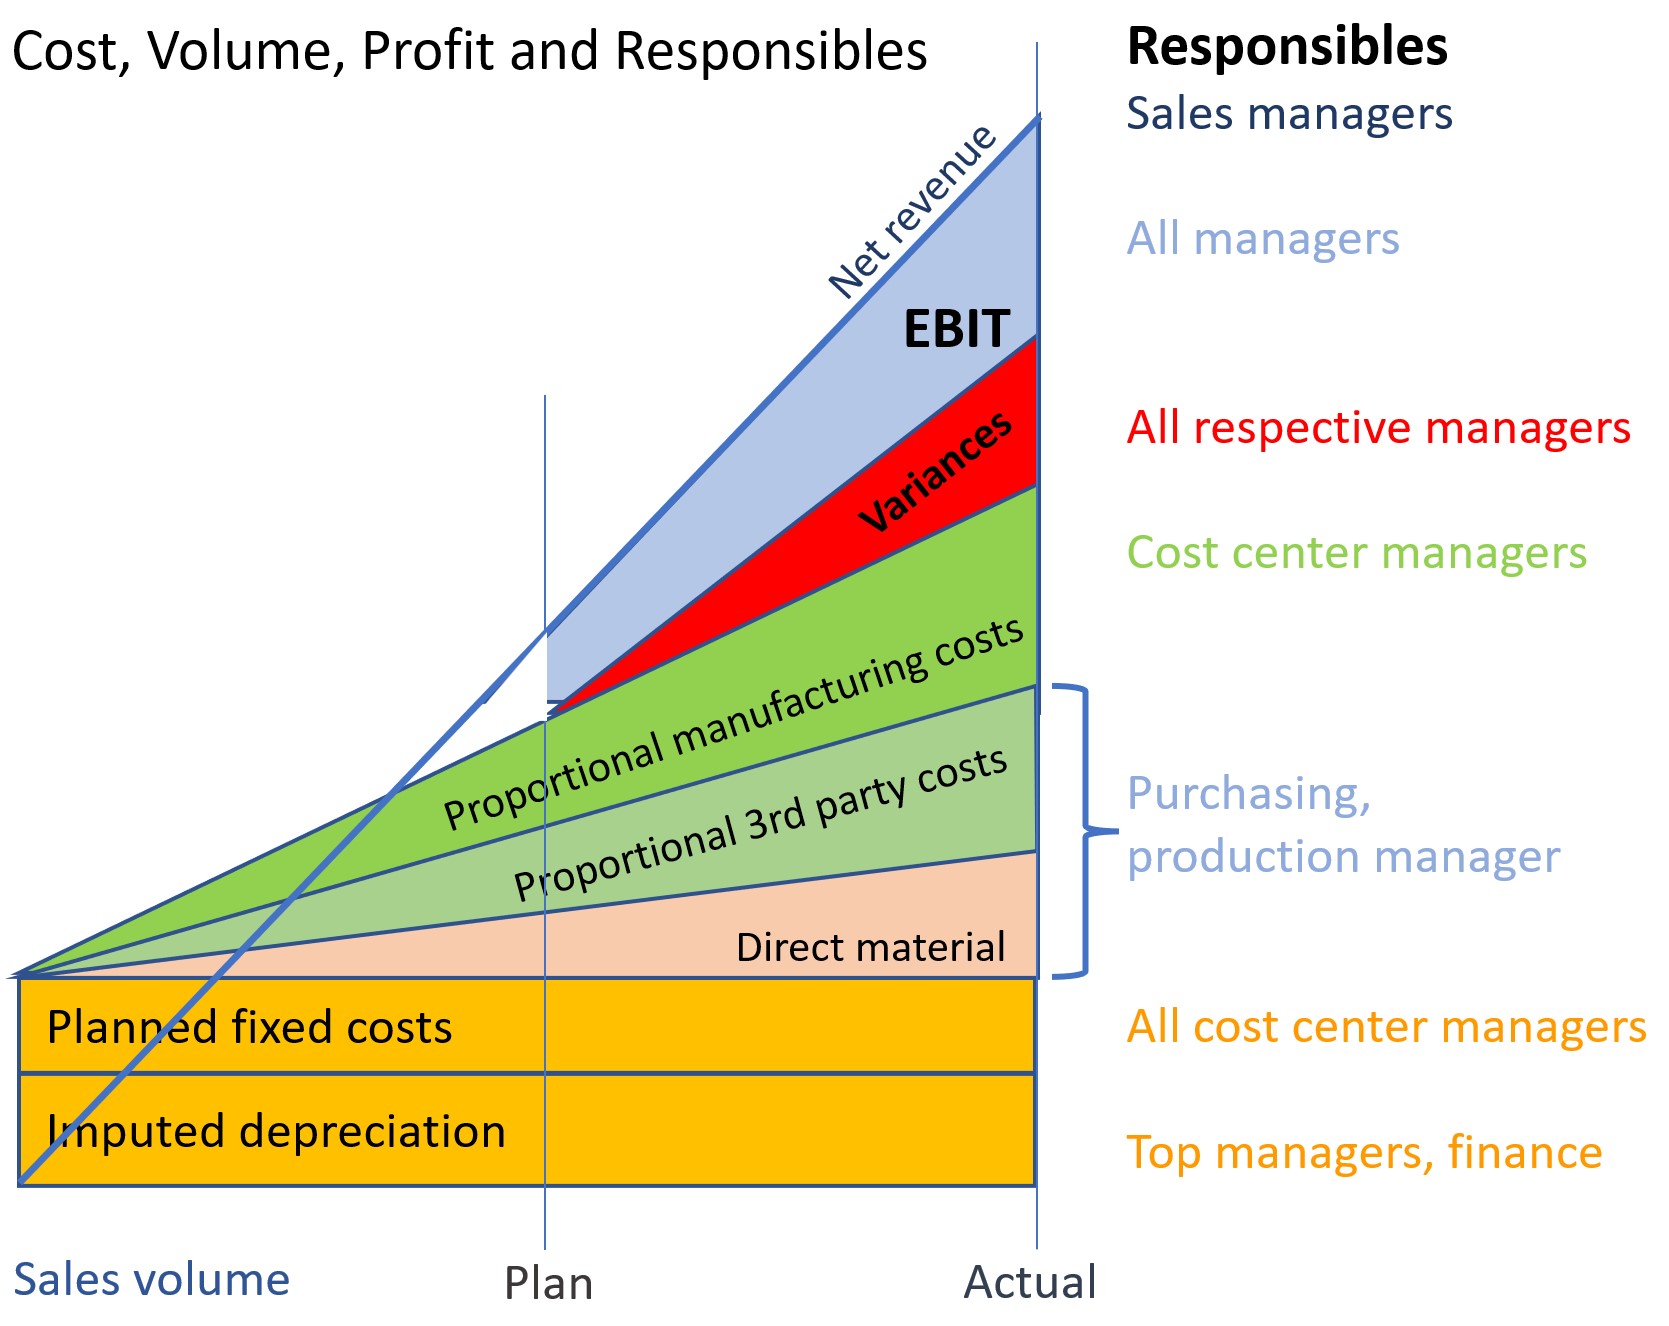
In the stratified presentation of the origin of results and profit, the contribution of the individual responsibles and their employees becomes apparent:
Decision-Making, Responsibility and Causality
Who is responsible for idle capacity?
The managers who bought too large a plant,
the salespeople who sold too little
possibly cost center managers, if they do not point out idle capacity to their colleagues.
From this it can be deduced that it makes little sense to allocate costs of idle capacity (especially personnel and depreciation costs) to cost centers or product groups. As mentioned, imputed depreciation and personnel costs are charged to cost centers because they are observed there.
Strong and weak causalities
In our opinion, a strong causality is given if the consumption of an input good, e.g. the output of a cost center or an employee, is directly caused by the storeable or saleable product. This is the case if a routing or/and a bill of materials can be created for the product or the service unit performed. In Grenzplankostenrechnung GPK, therefore, only proportional costs are charged to products or services, and the remaining fixed costs are transferred to stepwise contribution accounting. This is because fixed costs can only be changed by management decisions, such as firing an employee or purchasing a machine.
Weakcausalities do not show a direct dependency between output and input.
Example 1: Because the headcount has increased, the human resources department needs an additional employee for everyday personnel support. There is no rule how many employees one person in the personnel department can supervise. It is a management decision whether to hire the person or not. The costs directly attributable to a manufactured product do not change as a result of the increase in staffing levels, since no changes are required in either the bills of materials or the routings. But the fixed costs of the company increase.
Example 2: A company fills gas cylinders and delivers them to customers by trucks (see the case study “Le Petomane Gas in the PACE homepage“). Delivering to a remote customer requires an additional hour of travel time, resulting in corresponding fuel and labor costs. These could be saved if the customer is no longer served. On the other hand, the net sales minus the proportional costs for the delivered gas cylinders, i.e. the contribution margins I of this customer would be eliminated. This results in:
+ omitted transport costs – omitted contribution margins.
The proportional product costs per filled gas cylinder in the finished goods warehouse can be clearly determined since material consumption and work schedule for filling are defined in the technical bases (strong causality).
Example 3: Most companies have a central IT cost center for the implementation, operation and maintenance of applications and data. The resulting data and evaluations are used (to varying degrees) by many cost centers. In cost accounting, therefore, a search is often made for cause-effect chains by means of which the IT costs could be charged to the receiving cost centers. Mostly this search is unsuccessful because both the data sets and the applications are used by a wide variety of cost centers (very weak causality).
Nevertheless, many financial managers and cost accountants try to allocate the fixed costs of the IT department (including depreciation) to the various cost centers and from there to the manufactured products by means of one or more allocation keys. After all, according to the widespread opinion that each product must bear its share of the total fixed costs. However, the IT manager plans and controls the costs of the IT department and is consequently also responsible for them to the management. There is no need to allocate costs to individual cost centers and products. The contribution margin from sales must be sufficient to cover all fixed costs plus the target profit.
Insight:
In Grenzplankostenrechnung GPK, only proportional costs are charged to manufactured products because they were directly caused by the products (only strong causalities). Therefore, in management-oriented cost and revenue accounting, inventories should also be valued only at proportional (standard proportional product costs). This is because fixed costs are period costs and, as such, should be shown as blocks in the contribution margin accounting. They are to be controlled in the cost centers.
To put it even more clearly:
In GPK and in Resource Consumption Accounting RCA, fixed cost allocations have no place because these allocations are an attempt to delegate cost responsibility to units that have no direct possibility of influencing the costs at the point of origin.
Of course, it makes sense to include fixed costs in pricing for individual customers. However, in our view, this is activity-based pricing, not costing. Therefore, considerations about setting offer prices and conditions should be made outside the management accounting system, especially in the sales organization.
If in the Costing Levels Continuum Maturity Model from Gary Cokins the levels 11 and 12 are to be reached, all allocations of fixed costs must be eliminated, because otherwise no useful simulations are possible.
The term “Internal Tasks” stands for all work to be performed in a company that is not directly caused by the units produced or by the activity of the receiving cost center. Internal tasks are only indirectly related to the products and services produced or sold. For better distinction we always write the term in our blogs with a capital “I”.
Examples of Internal tasks:
Management, planning and control work in all areas
Work of all sales-oriented cost centers
The entire production planning and control as well as work preparation
Work of personnel administration, payroll accounting and the time spent on training and further education
Work of procurement, warehousing, forwarding
Development and operation of the entire information technology as far as its services are not directly caused by orders from individual cost centers or customers.
Work to keep buildings, company premises, installations and machines ready for operation
Administrative work to comply with legal requirements.
All these Internal tasks have in common that they are rendered to keep the whole organization ready to perform. How much work capacity is built up and provided by employees or plant capacity is decided by managers as part of strategic and operational planning.
Planning hourly requirements for internal tasks
More than 50% of total personnel costs are incurred for Internal tasks in many industrial and service companies today. Therefore, the annual hourly requirements for these tasks must be planned and recorded in each cost center.
The difficulty lies in creating reliable capacity requirement plans for all Internal tasks. On the one hand, this is due to the fact that people in these areas perform a wide variety of tasks more or less in parallel. On the other hand, only a few companies record time consumption for Internal tasks. This makes it difficult to plan requirements.
To get a better grip on capacities and the cost block for Internal tasks, we recommend since years that the worked hours for Internal tasks should also be recorded by types of work. The presence time of a person can be measured quite easily using time recording devices but many managers are not even required to perform this recording for themselves. But just from recording the presence time it is not possible to evaluate for which task type how much time was spent.
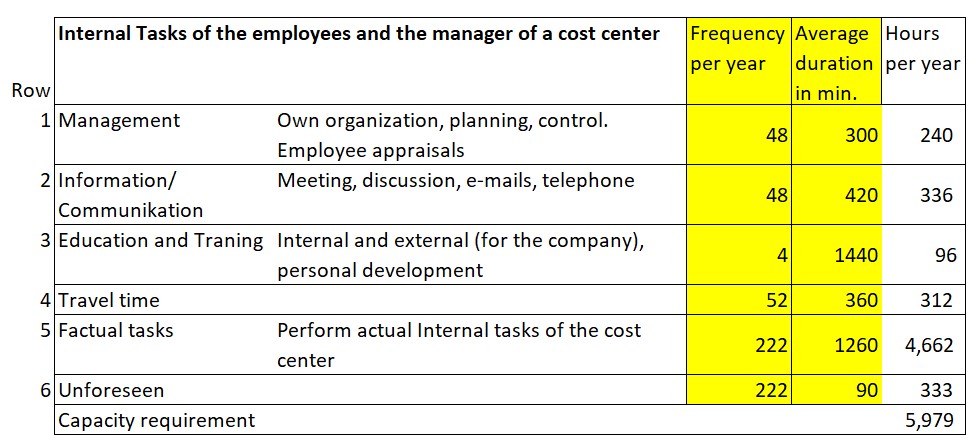
We made the experience that already the planning of the task types in the internal areas generates important insights for capacity planning. For this purpose, the Internal tasks are divided into six groups, which occur in almost every cost center:
Capacity requirements for Internal Tasks
For the factual tasks (Row 5) subgroups can be created in individual cost centers as needed. In the sales-related functions for example:
Addressing potential customers
Support of existing customers, preparation of offers
Capacity requirement for contract negotiation.
In the human resources department subgroups could be:
Recruitment and selection of personnel, payroll and social security
personnel and sickness care
Documentation of the potentials of managerial and professional staff.
Planning at this level of detail brings benefits to the whole company. Since employees are usually reluctant to record the time spent for different Internal tasks, a user-friendly and thus largely automated recording application must be set up.
Thanks to the lean production movement impressive improvements were already achieved in the area of directly product-related services and production management. Now it is time to apply the findings to Lean Administration as well (see the corresponding posts in the Lean Management area of this blog).