Countercurrent Principle

Planning and controlling from top to bottom or vice versa?

Countercurrent Principle

Anyone involved in the design of sustainable management systems automatically ends up with the question of whether to plan and control top-down or bottom-up. The answer is to proceed according to the countercurrent principle.

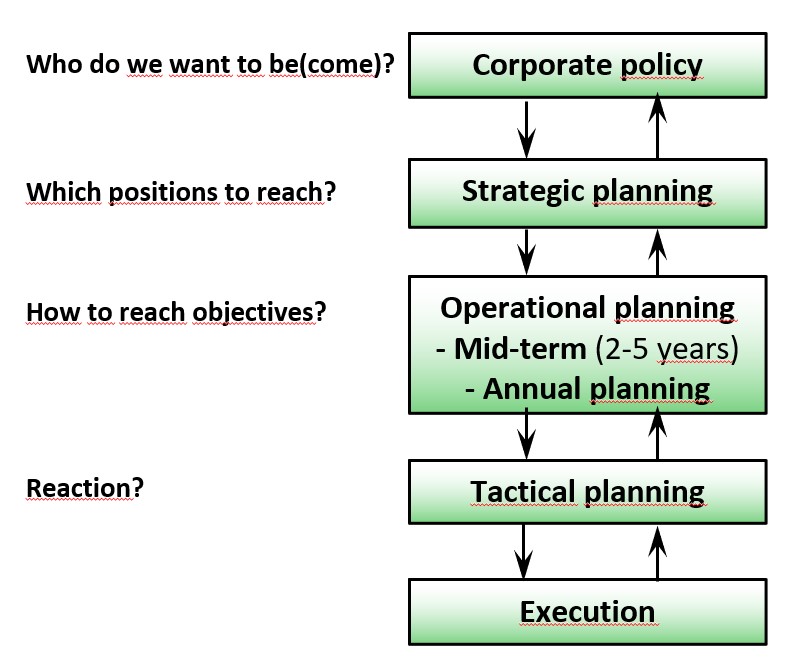
The post “The Main Questions of each Planning stage” shows that it is first necessary to answer what an organization wants to be or to become before implementation can be tackled. This determination is made by a small group of people, usually the owners. In corporate policy, they record their intentions regarding the markets to be served and the products or services to be provided for them. This is top-down leadership.

In strategic plans, the managers responsible for implementation specify which products and services they want to use to realize the corporate policy intentions in which markets (top-down). Before they can define the strategy, they have to make sure that the operating units of the company will be able to produce and sell the required products and services on time and in line with the market. To do this, they need feedback from the managers who will be responsible for implementation. The downstream managers assess from their operational perspective whether they have the personnel, factual, time and financial scope to implement the strategy operationally. This countercurrent assessment can lead to the adjustment of strategies. If this feedback is omitted or negated in decision making, there is a great risk that the strategies will cost more than they can deliver.

Countercurrent principle

In operational planning and control, the feedforward and feedback loop is repeated. The available personnel, the existing facilities and the current processes must be able to handle the projects required for strategy implementation in a proper and timely manner, to bring in the necessary sales at net sales revenues in line with objectives and to keep within the planned fixed costs.

Reporting must be bottom-up because actual data on sales, production, personnel development, project progress and the like are prerequisites for determining the target achievement of the objectives in a period under review.

These reports cannot be neglected in the next planning round if realistic objectives are to be agreed. The counterflow of data and assessments of real implementation thus forms the indispensable bottom-up input for agreeing on the next objectives.

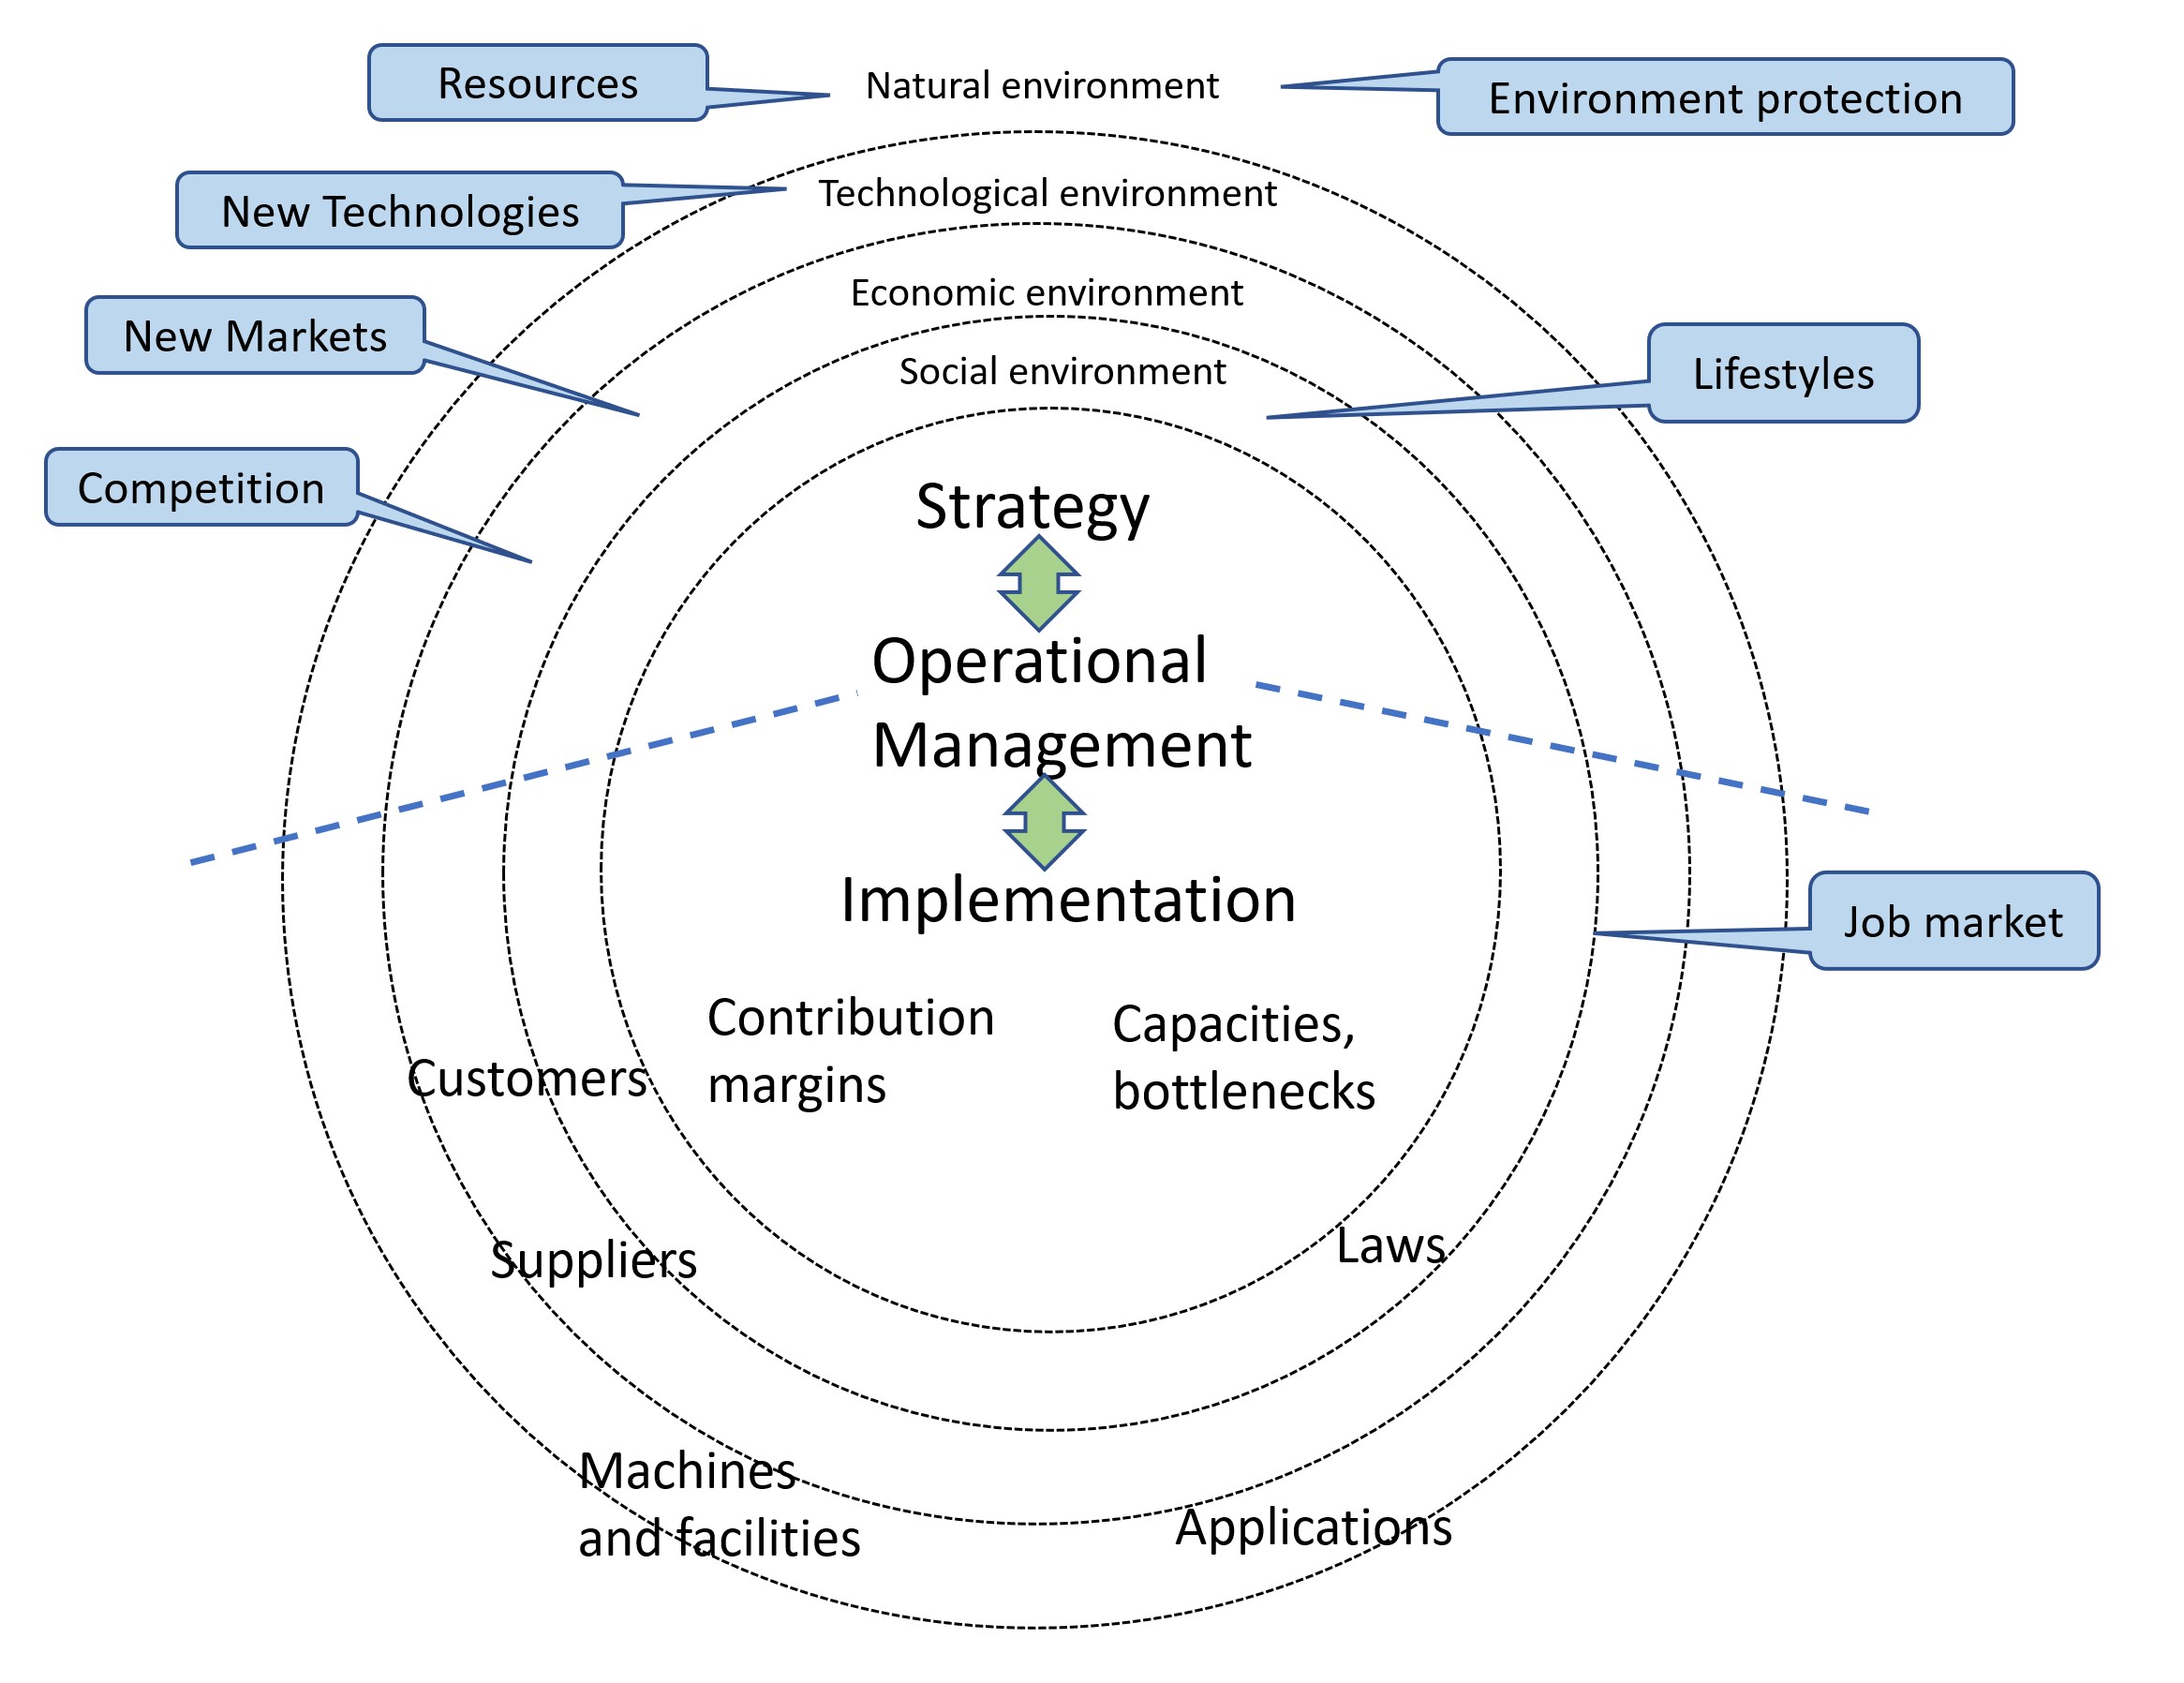
Another argument in favor of applying the countercurrent principle is that in strategic management, other, usually more uncertain data from the environmental spheres (cf. the post “Environmental Changes are Crucial for Management Control”), are collected and evaluated more than in operational planning and control. In addition, the time horizons are different. In the upper part of the figure below, the focus is on the internal success potentials required for strategy implementation. In the lower part, an assessment is made of how successful the implementation was and how the development of future success potentials went. This assessment may lead to the need to adjust the objectives for the next periods.

Environment and countrcurrent principle
Considering the development of the environment in the countercurrent principle

Conclusion: Planning top-down is a prerequisite for determining an organization’s future potential and realizing it on schedule. However, operational results, bottlenecks in manufacturing, delays in research and development, and customer and supplier bottlenecks or a dried-up labor market can lead to changes in operational and strategic goals. Feedback loops must therefore be built into the planning process. Committed employees often contributed ideas that led to the realignment of a company.

Agile team management is based on the assumption that teams act on their own responsibility. However, this does not mean that they can change their mission without considering the higher-level objectives (see “Prerequisites for Agile Team Management“).

Managing inflation internally

Managing inflation internally

A company can rarely pass on supplier price increases in full to its customers. Managing inflation internally is a must. This is because the company’s existing customers will, in their own interest, try to buy cheaper from other suppliers, consume less, use other input materials or even withdraw their own offerings from the market, because they are no longer profitable due to price increases. Potential new customers will also compare offered prices and services and order where they feel they get the most for their money.

A bidding company must therefore maintain its own profitability despite inflation so that it can continue to invest in its own future. Professor Simon calls this profit defense (p. 56 in the book Beating Inflation). In terms of planning and control, profit “should be included in the calculation from the outset like a cost variable to be covered (ibid., p. 52).” This requires the continuous increase of effectiveness and efficiency of one’s own actions. (Definitions in the glossary)

Effectivity = doing the right things

Efficiency = doing the right things right.

Therefore, all cost centers must find, decide on and implement measures that are suitable for achieving profitability in line with the market (see “Profit in Line with the Market “).

Cost reduction measures for functional areas

The ROI-tree from the post “ROI and Inflation” helps to generate ideas to increase profits, to evaluate these ideas from a financial point of view and finally to measure their implementation success. Exemplary starting points are structured below according to functional areas:

Managing Inflation internally

Sales, prices, conditions:

    • Announce and justify price increases quickly, even if customers temporarily switch to competitors (get ahead of the “cost wave” with price adjustments).
    • Increase prices in several steps to discourage customers from switching.
    • Do not give discounts at the time of ordering but pay refunds when a predetermined purchase volume is reached (sales model).
    • Fix terms of payment without cash discounts and accelerate the dunning process in parallel (cash discounts directly reduce profits).
    • Develop new pricing models, e.g. pay per use or pay per period (applies especially to products or services with low proportional manufacturing costs).
    • If the product or service is superior to competing offers, customers will buy at even higher prices.

Marketing, sales, distribution:

    • Care for existing customers according to ABC-analysis (A and B customers generate higher absolute contributions and should consequently be looked after more intensively).
    • Continuous procurement of new leads (addresses of potential new customers) and prompt contacting.
    • Largely digital customer engagement to reduce customer visits (less travel).
    • Analysis of contribution margin development after trade shows and exhibitions.
    • Fix advertising contributions to reselling customers as a share of your contribution margin and grant them only after the sales have been achieved.
    • Free delivery of a part of the order quantity often reduces the customer contribution margin less than direct discount percentages from the sales price, because only the proportional costs reduce the contribution margin.
    • Continuous monitoring of competitors’ prices, assortments and sales development to locate opportunities for new offers.
    • Completely automated dunning system to reduce days sales outstanding.

Manufacturing processes / production planning and control:

    • Larger production batches reduce proportional manufacturing costs per unit, as setup times are incurred only once per batch. It is worthwhile to regularly reconcile order intake with inventory levels and the size of production orders.
    • Train employees to master several processes and thus have less idle time.
    • Automate process steps. In times of inflation, it is often easier to obtain funds for investment, albeit at higher interest rates.
    • Continuously check whether suppliers offer certain semi-finished products cheaper than you can produce them yourself (in- or outsourcing based on proportional manufacturing costs plus direct fixed costs of your own process).
    • Introduce computer-controlled processing steps and thus reduce manpower requirements.
    • Digitalization of planning and control of production orders as well as production data acquisition.
    • Reduce scrap.

Purchasing and inventory:

    • Consumption scheduling per purchased item based on planned consumption of production and sales in order to achieve more favorable framework-agreements with suppliers.
    • Regular comparisons of purchase prices of potential suppliers. Have a substitute supplier ready for each procurement item.
    • Immediate information of the sales department and other affected cost centers in case of imminent price changes of important articles or services to be procured.
    • Report purchase price variances from budgeted purchase prices on a monthly basis to estimate the impact on product and services to be sold in subsequent stages.

Research and development: 

    • Find cheaper or more suitable input materials.
    • Reduce process turnaround time for customer-specific developments as quick responses build customer confidence.
    • Regular assessment of project progress with go/no go decision ends stagnant projects earlier and frees up research capacity.

Internal service areas:

    • Continually re-evaluate out- or insourcing (what do we maintain and repair ourselves, what do we outsource?).
    • Outsource maintenance and cleaning and reduce cadence if they are not a prerequisite for operational readiness (make fixed costs more controllable).
    • Do not charge fixed costs to recipients in internal activity allocation. The service provider is responsible for its own fixed costs.

Controller:

    • Fast execution of the planning process and prompt internal reporting are becoming increasingly important because inflation affects the procurement side quicker than the receipt of payments.
    • At low value added, cost management is concentrated on the purchasing side because purchase prices change quickly and strongly. At high value added, the focus is primarily on personnel costs. Inflation tends to lead to job cuts.
    • Introduce cost splitting into proportional and fixed costs both in planning and in target to actual comparisons.
    • Enable computer simulation of cost and revenue developments so that changes in volumes, prices and costs can be estimated in advance.
    • Apply dynamic investment calculations so that the effect of inflation on present values becomes apparent.

Management processes:

    • Determine responsibilities of individual management positions so that adherence to qualities, quantities, deadlines, and results can be determined.
    • Introduce company-wide Management by Objectives and regularly measure and assess the achievement of objectives by individual employees.
    • Introduce shop floor data collection also in administrative areas to continuously reduce time consumption in these areas.

Fighting inflation internally is the task of managers at all levels of the hierarchy. If they do not manage to make the total value-added costs grow slower than net revenues, the company will lack the profits to invest in the future and will disappear from the market over time.

ROI and Inflation

ROI and Inflation

The ratio Return On Investment ROI is defined as:

Profit before deduction of taxes and interest (EBIT) : invested assets.

EBIT (100) / Balance sheet total (1,000) = ROI (10%)

The financing structure, i.e. the shares of debt and equity on the balance sheet total, is therefore not taken into account. This enables the profitability comparison between different companies even if they have different financing structures.

If the revenue and cost sides of a company are broken down into their main components, it is possible to see which items affect ROI and to what extent. We call this representation the “ROI tree”.

ROI and Inflation
ROI and Inflation

In the example, 200,000 units were sold at a gross price of 50.- per unit. This corresponded to the gross revenue of 10.0 million. 10% discounts and other sales deductions were deducted from this, resulting in net revenue of 9.0 million (1a, 1b, 2).

The direct material and unit-related external service costs amounted to 8.50 per unit (3a, 3b, 4). Manufacturing consumed 24 minutes per piece, which at the rate of 40.00 per hour resulted in a proportional manufacturing cost of 16.00 per piece. Multiplied by the production quantity of 200,000 pieces, the proportional production costs were 4.9 million (5a,5b).

This resulted in a contribution margin I (CM I) of 4.1 million.

CM I was used to cover the fixed cost center costs of the functional areas (6, 7, 8), which resulted in a cash flow before deduction of interest and taxes of 0.9 million.  After deducting imputed depreciation and amortization of 0.4 million, the profit before interest and taxes (EBIT) was 0.5 million.

Dividing the EBIT of 0.5 million by the assets invested in the period of 5.0 million (9, 10, 11) gives the ROI of 10% in the year under review.

Effects of inflation

    • If the suppliers of materials and external services increase prices by 5%, this results in a cost increase of 0.085 million for the company. The graph shows that this amount has a direct impact on EBIT and thus also on ROI. See also the post “Purchase Price Variances are topical again”).
    • In the same way, price increases for auxiliary materials and purchased services have an impact on the cost centers. This affects the production centers (5a, 5b) as well as the cost centers of the other functional areas (6, 7, 8).
    • If machines, buildings, equipment and intangible goods become more expensive, the imputed depreciation increases as a consequence, which again lowers EBIT and thus ROI (12).
    • Another consequence of inflation is that employees lose purchasing power. They will demand – somewhat delayed – higher wages (5b, 6, 7, 8).
    • On the left side of the balance sheet, inflation also leads to higher invested assets.
    • If inventory levels remain the same, the average value of the stock will rise (10).

Banks will raise interest rates on loans, which will reduce pre-tax profits. In the end, business owners (partners, shareholders) will also demand higher dividends because the purchasing power of their dividend income will also decrease.

Conclusion: Inflation is a vicious circle that must be broken by all means. In the private sphere, renunciation must be practiced in order to cope with disposable income and assets. In the corporate sector, attempts must be made to push through price increases. In doing so, there is always the risk that customers will jump to other suppliers, resulting in a drop in sales. Even more important is to strive to improve efficiency in all areas, i.e. to break the vicious circle through more cost-effective processes and structures.

Starting points for improving efficiency are the subject of the next post.

Beating Inflation

Beating Inflation

Beating Inflation” is the title of the book by Prof. Dr. Hermann Simon, the “old master” in price management and profit control, published in 2022. This publication deals with the demands that the currently again rampant inflation places on corporate management. Many of his statements are also essential inputs for the design of a comprehensive management control system and thus for the sustainable success of a company. In this and in the next two posts of this blog, his insights will be combined with the design of the comprehensive planning and control system of a company.

After a period of about 40 years with hardly any significant inflation rates, Europe and the entire English-speaking world are affected by massive price increases as a result of the COVID pandemic and war-related events. Many managers are experiencing inflation intensely for the first time and need to understand how to plan and act in such a situation in order for their companies to survive successfully.

How price increases propagate

Generalizing, price increases are the result of bottleneck situations. Bottlenecks can arise in various areas when demand is greater than available supply. Insufficient supply capacity is often due to:

    • Raw material availability in the required qualities too low
    • Lack of transport capacity or transport containers
    • Political/legal supply restrictions
    • Inability to comply (yet) with regulations on manufacturing processes or guarantees of origin
    • Insufficient personnel capacity for processing and handling
    • Too little equipment available for manufacturing or insufficient manufacturing capacity
    • Too much capital investment ris equired for manufacturing.

Such bottlenecks lead to cost increases for suppliers of material and services. They try to pass on the cost increases to their customers in the form of higher net selling prices. If this succeeds, the purchase prices for the (further) processing companies rise. These price increases must in turn be passed on to the next (production) level. If a company cannot successfully pass on its higher costs, it will sooner or later incur losses, become insolvent and go bankrupt.

Beating Inflation
Beating Inflation

At the end of this chain are the end customers, usually private individuals. If purchase prices rise for them, they consider which of the available products and services they will continue to buy, taking price increases into account. This is because they only have their disposable assets and regularly recurring income available for consumption. Customers usually opt for what they consider to be the best price/performance ratio.

Suppliers at all levels try to circumvent, delay and keep price increases as low as possible in purchasing by means of negotiations or changing suppliers. In sales, the aim is to pass on the price increases that have occurred. Whether this is fully successful depends on the preferences of customers on the one hand and on the behavior of competitors on the other.

In order to remain successful in inflationary times, one’s own company must succeed in interrupting the price increase spiral. Inflation is thus a challenge for all employees, because all functional areas are affected, and above all the entire management. Countless ideas for improvement have to be generated, evaluated and decided upon. Furthermore, the interruption of the inflation spiral has to happen quickly, because otherwise the financial result will suffer. Above all, the following must be adjusted:

    • The assortment to be offered and the assortment width
    • The pricing process from gross price to net revenue
    • The marketing, customer acquisition and sales processes
    • The distribution channels and the definition of target customers
    • The product development and design
    • The manufacturing processes and the input materials to be used
    • The purchasing process and the choice of suppliers
    • All administrative processes
    • The data integration and the automation of administrative processes
    • The investment planning as a result of the process changes.

Professor Simon estimates that most companies can only pass on about 50% of the inflationary cost increases on the procurement side to the customers; the entire cost side in the company must also make a contribution to the profit defense (p. 191).

The next post will go more into detail on which measures have how strong an impact on profits.


Costing or pricing 2

 Costing or pricing 2

Offer leatherette presentation folders?

In the analysis below the net planned revenues are related to the expected costs of the products, the costs of the planned marketing and sales measures and the necessary investments. This is used to assess whether the entire project will be profitable and can be released for implementation.

This requires a multi-year view, because investments in fixed assets (additional machinery, capacity expansion) are to be expected and the sales volumes as well as the achievable net revenues may change in the course of the project’s life cycle. In addition, it must be taken into account that expenses and costs are incurred at times different than the net revenues. The cash inflows and outflows of the individual years must therefore be made comparable. This can be achieved with dynamic capital budgeting.

The expected annual net revenues (line 4) are taken from the table on planned sales/revenue development (cf. Costing or Pricing 1).

Since the leatherette presentation folder does not yet exist, the bill of materials and the routing for this product are still missing. As a basis for calculation, the consumption data of a product that is as similar as possible and has already been manufactured can be used. These are supplemented by the expected additional individual material items and production activities. This results in the proportional planned production costs per presentation folder (line 5). If higher purchase prices and proportional cost rates are expected in the years to plan, these cost changes can be taken into account for each planning year.  For the time being proportional product costs of 8.00 per presentation folder are assumed in all years. Multiplied by the planned sales quantities (line 2), line 6 shows the annual proportional planned product costs and line 7 shows the contribution to be achieved with the presentation folders in every planned year.

Costing or pricing 2

The annually expected additional fixed costs to be ready to introduce the presentation folder and to generate the annual planned sales quantities are entered in lines 8 and 9. These can be external costs for product-specific advertising, additional costs for the creation of product catalogs, external costs for supplementing the company’s own website and additional personnel costs for the support and administration of the new products. It is important to note that only items that lead to changed cash outflows are taken into account (no allocations).

The result is the annual expected net cash return from the project, i.e. the cash flow before interest and taxes CFBIT (line 10).

The CFBIT is first used to pay for the investments resulting from the project, i.e., additional machinery, capacity expansion of existing facilities, and possibly external rent for additional premises. Higher accounts receivable balances which are expected to follow from the increase in invoiced sales must also be taken into account. If the volume of purchases from suppliers also increases as a result of the new product, the accounts payable balances will increase as a consequence. As a result, the cash outflows only occur in the subsequent period (line 11).

The balance of the annual cash outflows and inflows is shown in line 12.

This line shows that the net cash flows of the years 1 – 3 will be sufficient to cover the new investments and the changes in accounts receivable and accounts payable in years 1 – 3. The payback period of the presentation folders project is a bit more than 2 years.

However, from the point of view of the owners (shareholders) and the lenders (banks), the project should also yield a rate of return in line with the market as they consider whether they should invest their money in Ringbook Ltd. or in another company. To convince the lenders and the owners of the profitability of the project, the management of the company should therefore discount the expected future net cash flows to the moment of the project decision.

For this purpose, the present value of the nominal annual cash flows at the time of the decision should be calculated. Example:

Assuming an interest rate (i) of 10% per annum, a cash return of 1,000 that occurs exactly one year after the project decision has a value of 909.09 at the time of the decision. This results from the discounting formula:

Present value = cash flow x 1 : (1 + i)^1 = 1.000 : 0.90909.

This discounting calculation is done in lines 13 and 14 for each year. The discounted annual cash flows were added up in line 15. The cumulative present value of the project at the end of year 2 is +8,182, which means that the introduction of the leatherette presentation folders will pay for itself after only two years, even taking into account 10% interest.

You can download the generally applicable model for quantifying investments, projects and strategic plans as an Excel model here and adapt it according to your needs.

The market interest rate of 10% used here is up to date for the German-speaking world. In our book 360°-Management, pages 243 ff, we calculated and published the market-driven interest rates of various industries in different countries in 2015. In 2022, it was found that the interest rates stated there are still up to date for German-speaking countries and for the USA.

Conclusion for the financial assessment of plans and especially projects:

    • Pricing comes before costing: Estimating possible sales quantities and net prices and comparing them with competitor offers is a prerequisite for assessing the profitability of projects.
    • Separate plans must be drawn up for direct customers and sales intermediaries, as net sales revenues vary widely.
    • Sales deductions reduce the contribution margin in the same way as proportional product costs.
    • The direct costs of acquiring new customers must be included in the plan as fixed period costs.
    • The sales and revenue plans have to be compared with the anticipated proportional product costs of the services and products. The resulting contribution margins I must at least cover the fixed costs of the projects.
    • The market and the salespersons determine the sales price and the net revenues, not the costs.
    • Full costs per product unit can be calculated but are not relevant for decision-making because of the fixed cost breakdown.
    • Feed-forward and feedback are normal in the planning process. It is important to continuously take into account the resulting changes in the plans.
    • Multi-year horizon: The expansion or contraction of the customer base as well as the company’s own range of products and services always have long-term effects. Therefore, multi-year considerations are usually relevant for decision-making. This speaks in favor of the application of dynamic and money flow-oriented investment appraisal.
    • Question the assumptions, create and compare several variants of the investment calculation. This makes it possible to include the consequences of different estimates in the decision-making process.

Costing or Pricing 1

Costing or Pricing 1

In management, the question often arises as to whether it is primarily the sales prices and the company’s own costs that determine the company’s profit, or the design of the product range and of the market presence. Should planning start with costing or pricing?

Mostly the market, i.e. the potential customers and the competitors, as well as the skills of a company’s salespersons make the price. However, only the excess of the net revenues over the costs incurred for them results in the company profit. The profit of individual products or individual customers can neither be determined on a cause-and-effect basis nor for a single year because the costs of the readiness to perform (fixed costs) cannot be charged to customers or products/services on a direct cause and effect relationship (see the post “Full product costs are always wrong!“).

Managers have to decide whether to add a new product or even a product group to their product range, to serve new sales territories or sales channels, or even to invest in new technologies. For such expansions often investments have to be made and new cost elements arise in order to generate additional sales and contribution margins.

First it is necessary to estimate sales volumes, sales prices and net revenues per product, because this pricing-oriented data creates the basis for planning and determining the necessary investments and costs. It is necessary to think from the market into the company. The following rough sequence emerges:

    1. Prepare ideas for new products or services.
    2. Analyze competing products or services and thus expected competitors.
    3. Estimate possible sales quantities and net prices in various market dimensions such as sales territories, sales channels, product groups.
    4. Plan the quantities and the net revenues per item, per sales territory and per sales channel.
    5. Estimate annual additional costs for marketing, advertising, sales promotion, customer service.
    6. Decide.

Only when estimated values for point 4. are available, it makes sense to plan the costs and investments necessary for the implementation.

To generate a plan-calculation Dynamic Capital Budgeting is the suitable instrument (see the post “Dynamic Capital Budgeting”). This is because it allows sales and net revenue estimates to be compared with cash outlays for new investments and expected costs, the payback period to be calculated and the present values to be discounted to the decision point. Existing contribution margin and cost/performance calculations can provide essential planning inputs, but they do not yet include the new products and submarkets. It is therefore advisable to first calculate the expected net sales and contribution margins in a separate table.

Offer leatherette presentation folders? (Costing or Pricing 1)

The management of Ringbook Ltd. is discussing the idea of adding high-quality presentation ring binders with imitation leather covers to the product range. These ring binders for presentation should help customers promote their own offers more successfully.

The leatherette folders are to be sold through the existing three sales channels (direct sales to companies, to retailers for resale and via online store). For the time being, sales are only planned in the home market (Switzerland).

Market assessment

In an initial assessment, the sales management and the sales staff of Ringbook Ltd. agreed on the following potential net sales prices (after deduction of discounts of all kinds) and sales volumes for the Swiss home market:

Costing or Pricing 1

The salespersons in the respective regions estimated the sales volumes of presentation folders that they believe can be realized (line 1). The assumed development of the planned sales quantities shows that they assumed that the life cycle curve of the product will reach its peak in the fifth year and that subsequently the sales volumes will decrease.

Ringbook Ltd. grants its customers various discounts on list prices and on order values. The total average discounts granted to date have already been taken into account in the net sales prices. This explains the different net sales prices per unit (lines 2).

From this, the net sales to be achieved with the intended presentation folders were calculated for the individual years per sales area. Lines 3 also show the estimated average selling prices per unit.

The inclusion of presentation folders in the product range is intended to help Ringbook Ltd. be included in the inner circle of potential suppliers of sales support aids for all potential customers. This should help to continuously improve the company’s own market position.

The table with the sales channel-related planned sales quantities and net revenues is thus an approach to quantify strategic intentions. It is the basis for comparing the planned net revenues with the expected costs and expenses. Only this comparison can show whether the expansion of the product range will also improve Ringbook Ltd.’s financial result.

Management Accounting and Managerial Decisions

Management Accounting and Managerial Decisions

Managers decide on the people to be employed, the procedures, the capacities, the market presence and the results to be achieved. In their respective management areas, they are responsible for the results. A management accounting system must therefore be designed that each manager can see for his area of responsibility what the direct consequences of his decisions will be or have been.

What do managers decide?

Customers decide whether to place an order or not. If an order is placed, the product, quantity, price, conditions and delivery date are recorded. This information defines gross and net revenue of the order. Based on the bills of material and routings as well as on the planned purchase prices and proportional cost center rates, the proportional planned costs of the order can be calculated.

The difference between net revenue and proportional costs is the contribution margin I of the order (not the cost of sales).

Management accounting and managerial decisions

To execute the order, managers must ensure that the company is operationally ready to perform. The equipment must be ready for operation, the personnel must be available and ready and the technical and procedural requirements must be met. Managers are thus responsible for the company’s readiness to perform and for the resulting costs. They decide which personnel, which facilities and which internal services must be available so that production and sales can take place.

Decision-relevant management accounting

To enable managers to make decisions and to take responsibility for the results, three dimensions of costs and revenues must be represented simultaneously in management accounting:

Proportional and fixed costs

Proportional costs are causally necessary to produce a unit of a product or a service.  According to the bill of materials a given product or service unit consumes material and/or external services. According to the work plan this product also consumes cost center services. The valuation of these consumptions with the planned purchase prices and the proportional planned cost rates of the cost centers results in the proportional planned product costs. These are the only costs directly caused by the produced unit.

Fixed costs are given by the capacity and the structure of the organization. This is also true for most depreciation costs because most equipment becomes technologically obsolete faster than it could be used. Fixed costs are the complement of proportional costs:

Total costs – proportional costs = fixed costs.

Controllability of costs

If a manager wants to change costs in his area, he must know in which time period these costs can be influenced. Hourly paid employees usually have a shorter notice period than permanent employees.  Contracts with suppliers can also be concluded for shorter or longer periods. The basis for depreciation of fixed assets only changes when the asset is replaced or taken out of service. Both proportional and fixed costs may have different time periods for them to be affected.

Traceability of costs

All cost and revenue documents are to be assigned to the lowest competent and thus responsible hierarchy level (customer, production or research order or cost center). This is also where costs can be directly influenced. Direct cost assignment to the lowest possible level also accelerates and simplifies the management process (delegation principle).

Cost Cube
Three dimensions of costs and revenues

Cf. Controller Dictionary, p. 146

Proportional costs are directly caused by the product or service manufactured or by services explicitly asked from other cost centers.

Fixed costs are incurred for the organization’s readiness to perform. They are always assigned to a cost center because the manager of the cost center is responsible for them. Therefore, the allocation of fixed costs to a single unit manufactured or sold is not accurate.

The main purpose of management accounting is the planning and control of revenues and costs by the managers directly responsible for them. These persons must know which influencing variables they can control on their own responsibility. Requirements from tax laws and accounting standards (US GAAP, IFRS) are not relevant in management accounting because the focus is on corporate management, not on external reporting.

We have implemented this management accounting-system for many years with the help of German Grenzplankostenrechnung GPK (or Resource Consumption Accounting RCA) and of stepwise contribution accounting. This combination of instruments works in manufacturing, trading and service companies as well as in selected public administrations. Our intention is always to serve all managers with decision-relevant information for their area so that they can take responsibility for the results.

Function Diagram

Function Diagram

In its conventional form, the function diagram compares a group of tasks of an organization (vertical column) with the contributions that the persons or areas involved are to make to the fulfillment of these tasks (horizontal column). In the fields of this two-dimensional representation, the contribution to be made is indicated by a letter. The letters “PDECI” can be used to enter the contributions of individual persons or departments:

P plan

D decide (on the implementation of the plan and the quality of the result)

E execute

C check (what result has been achieved?)

I inform (who receives news about what has been achieved?)

A function diagram thus replaces a lot of text that usually has to be entered and maintained in job descriptions. On one hand, this saves recording and maintenance effort in personnel administration, and on the other hand, it is possible to see in one line for each task who makes which contribution to it.

Example: Sales promotion for the product group “Filing aids”

Function diagram
Function diagram

The tabular presentation can be expanded in many ways. Contributions from external companies and their employees can also be listed (columns D and E), deadlines and brief descriptions of the tasks can be attached. Likewise, the working time consumption to be planned for each individual task can be entered.

Also the strategic planning process can be supported with the function diagram. The intermediate results necessary for strategy determination and even more for strategy implementation can be described, assigned to individual persons or areas involved in the process and detailed. The (intermediate) results achieved can be documented. In additional columns planned and actual deadlines can be recorded for each task. It makes sense to also record the working hours used for this (planned and actual).

Planning and Control of Internal tasks

For products and services that can be sold or stored, the planned and actual working times are usually stored in the product-routings in the ERP-system, since they are to be linked to management accounting. The ERP also describes how the manufacturing process is to be handled.

However, this activity-related connection does not exist for the Internal tasks, since there is no direct cause-effect relationship between quantities produced or sold and time consumed for tasks such as cost center management or for handling a purchase process. To be precise we mark Internal tasks with a capital “I” because they include all work performed in cost centers that is neither directly caused by the manufactured and sold products nor requested by other cost centers according to their free will (see glossary).

It therefore makes sense to expand the function diagram into a veritable database that can be used by all employees and their bosses for planning and measuring their work. From a management point of view, a corresponding application should be able to collect and evaluate the following data:

    • Internal tasks (catalog)
    • Subtasks of an Internal task
    • Planned demand in hours p.a. per Internal task
    • Cost centers (where work is done, functional area assignment)
    • Contribution types (PDECI) of those involved in an internal task
    • Time requirement plan (recorded by cost center manager or employees)
    • Employees (who is working on the task, personnel costs?
    • Work performed with time and date (personal worktime recording)
    • Plan to actual comparison of work done
    • Service recipient (customer, cost center, project)

To use these data for planning and control, different files, which are already kept in many companies, have to be connected by a data model and a corresponding application.

Comparing planned to actual time consumption, planning for the next few years can be improved and costs of individual tasks can be calculated by reverting to payroll administration data.

The columns can be extended down to the level of the individual employee. Additional columns can be used to record deadlines per task and quantify the costs of these tasks.

In a large number of companies, the execution of Internal tasks already consumes more than 50% of the total personnel costs. Yet in our experience this cost block is rarely planned and controlled in a results-based manner. Function diagrams for Internal tasks can help to ensure that their grow less than proportionally compared to the development of sales and contribution margins. This increases competitiveness.


Improve Productivity

Improve Productivity

An organization becomes more productive if it succeeds in increasing its output while either keeping the input the same or, even better, reducing it. In the post “Profitability“, the measurement of productivity ratios was explained. These entail dividing output by the inputs consumed;the change in these ratios over time should be tracked. In the example of the mentioned post, a labor productivity increase of 11.11% was calculated by dividing the units sold (units of output) by the complete labor hours used by the company (hours of input). However, this ratio is of limited use for planning and controlling the company as it does not indicate which processes have become more productive and by how much. Productivity metrics are needed at the cost centers and process level as many sub-processes need to be continuously improved.

It is difficult to measure productivity development in smaller units, e.g. individual cost centers or processes. This is because improvements are to be achieved there first. In manufacturing it is possible to see whether processing times for a particular item in a cost center are decreasing over time by evaluating order-related activity recording. But to measure productivity improvements in internal processes and cost centers is tricky as often the output measure cannot be clearly delineated, because the activities of different cost centers contribute to the output and because their work effort is not (or cannot be) measured.

Example 1: Ticket answering in IT

Many data centers have set up ticket systems to process and respond to error messages or requests from system users. The output of such ticket systems is answered requests from system users. In order to measure output, it is necessary to define what is to be considered as a response and thus as an output (i.e. problem solved, systems running again or only the explanation of why the error occurred and how it can be avoided in the future).

The input measurement requires further determinations:

    • What work times to fix the error are to be measured? (The processing time of the assigned IT employee, of all parties involved, or even that for external support?)
    • Are the speed of response and the time to complete problem resolution also to be measured? If so, how are they weighted?
    • Are financial inputs also to be included, such as invoices from third parties, higher royalties, or depreciation? If so, the inputs must be equated, which can only be done using monetary values.

Example 2: Productivity in personnel administration

It is possible to determine whether the average number of hours required for the salary administration of an employee decreases over time: output = 1,000 salary receivers, input 30,000 hours p.a., i.e. 30 hours per person per annum. If an employee of the warehouse retires and is not replaced, 30 hours should be saved in the HR department per year. Only if in HR less than 29,970 hours are consumed has productivity of salary administration increased.

This means that the outputs and the inputs of the personnel department are to be differentiated, in order to gain deeper insight into the changes in productivity of their processes. How much working time is used for:

    • Recruiting and hiring employees
    • Recording and maintaining employee data including performance appraisal documentation
    • Payroll accounting, social insurances, settlements with third parties
    • Supervision of internal and external training and further education
    • Planning and execution of internal training events Coordination with works council and trade unions?

Example 3: Recording of sales order data and packaging for delivery

In the example company Ringbook Ltd. the productivity of sales order processing and of collecting and packaging the delivery for the customers should be increased. The costs of transporting the goods to the customer are not taken into account, since the delivery is carried out by external companies (post office, delivery service, transporting company) and invoiced to the customers according to the transportation price list. Only the personnel costs for these operations are considered. The analysis resulted in the following values:

Improve Productivity

In fiscal year 2021, 293 customer orders were processed with a total of 471 order positions. According to service recording (recording of hours used for internal tasks), see the post on internal tasks , 2,250 hours were worked in the sales department and 2,355 hours in the warehouse for the preparing and packaging of the positions sold. These hours were multiplied by the weighted hourly presence rate of the employees involved. This resulted in the personnel costs of the packaging, shipping and invoicing process of 333,140 EUR. On average, the processing of a sales order consumes 4,605 hours divided by 293 orders = 15.72 hours, resulting in personnel costs of 1,137 EUR.

The productivity of the invoicing and delivery process thus improves if the average personnel costs per sales order can be reduced below 1,173 EUR.

Measuring working times for internal tasks

The three examples show that productivity improvements must be sought and identified primarily in the individual cost centers and in cross-cost center processes. To this end, time consumption for processes must be measured first and foremost, which is particularly difficult in areas not directly related to production.

It is necessary to be able to conclusively identify the contents and results encompassed by a process. Additionally the recording of activities must be structured in such a way that the work performed can be recorded according to these delimitations and that linked work steps of other cost centers can also be recorded, e.g., the working time of the production data management in order to be able to trigger and track a production order.

To evaluate ideas for productivity improvement, it is necessary to be able to measure or at least estimate consumption, especially of employee hours. With this in mind, planning and recording consumption for internal tasks will be covered in more depth later in this blog.

Investments for productivity increases

When looking for productivity improvements, often the question arises as to whether individual tasks should be outsourced to another company or whether investments in hardware, software or automation might be worthwhile. In such cases, Dynamic Capital Budgeting proves to be an effective means of quantifying process-related changes. This is because it can also include investments and changes in consumption of material and worktime. Cost savings are compared with the investment amounts and the expenditures for external services, and their effects are quantified for the planned useful life of the project.

More details in the post “Dynamic Capital Budgeting”  (will be published Jan.3rd 2023)

Simulation models

Simulation models

In simulations the chances of a decision are compared to its possible risks, quantified and evaluated. Users of simulation models are primarily the decision-making executives. Since decisions can only be made for the future, assumptions are first made regarding quantities, times and values to be achieved.

In order to increase the reliability of decision-making, as much reliable knowledge as possible should be incorporated into the simulations, i.e. previously realized quantities and net sales prices as well as actual costs. This can be sales volumes and net sales revenues realized with previous customers as well as the proportional and fixed costs incurred for these. A management accounting system provides this data if it meets the requirements described in the post “10 principles for Decision Relevance“.

    • If new customers are to be won with the existing services and products, it must be estimated what additional contribution margins are to be won with these new customers and whether new investments or higher fixed costs are to be expected for this growth. The additional contribution margins to be generated must at least cover the delta of fixed costs plus the delta of imputed depreciation from the investments.
    • If new products are to be added to the range, it must be estimated how much additional contribution margin can be generated by this expansion and whether this will be able to cover the additional fixed costs (including change in imputed depreciation) that have also been estimated.
    • If investments in information technology are to reduce the costs of planning and handling internal processes and documentation, it is necessary on one hand to estimate which cost center costs leading to cash outflows can be reduced and to what extent, and on the other hand which investments will be required for this and during how many years these investments can be used.

Is a campaign to win new customers worthwhile?

The sales management of Ringbook Ltd. is considering a campaign to acquire additional customers. From November to January, then when the filing cabinets for the following year are labeled in the companies, potential new customers are to be contacted. Article 105010, the standard ring binder for filing, is to be offered in this canpaign at the gross special price of 2.90 instead of 3.60 (approximately 20% discount). In the advertising brochure  however the offers for customized ring-binders are to stand in the foreground. At Ringbook Ltd. these products generate higher contribution margins per unit than the standard products.

It is planned to produce and stock an additional 20’000 units of ring-binder 105010 after the summer break. For the advertising campaign (letters and emails), a budget of 14’000 EUR is planned for brochures (design and printing) as well as envelopes and postage. 5’000 potential customers are to be contacted. The internal sales department will pack and mail the brochures. Should this advertising campaign be carried out?

Structure of the simulation model

The simulation model should be able to show how changes in the key values could affect the financial success of the promotion. Key values are:

    • How many potential new customers should be contacted, what proportion of them will order how many pieces of article 105010?
    • How many items sold at the special promotion price are needed to cover the costs of the promotion?
    • Are the personnel and machine capacities available to produce the planned quantities on time? Will this require working hours with shift allowances?
    • Can the existing internal sales staff perform the work for the promotion or are higher than planned personnel costs necessary for this?

Relevant for the decision are the assumptions made by the managers and existing data from the planning and control system of Ringbook Ltd. (see Management Control System, integrated planning and control and the simulation model contained therein).

The red fields are the preliminary assumptions of the managers, the blue fields contain the initial data from the simulation model of Ringbook Ltd.

Simulation models
Simulation models


Columns 1 – 3 contain the calculation basis:

    • Gross sales divided by sales volume gives the applicable gross sales price of 3.60
    • The 17.4% is the average discount rate granted to existing customers based on their customer group membership. This gives the net revenue of 375’705 in line 5, column 2.
    • The proportional product cost per unit 105010 of 1.02 also comes from the simulation model.
    • With this information, the CM I per unit and per period (246’672) is calculated.

In column 4, the key values of the planned action are linked to the initial data:

    • Planned quantity, 20,000 pieces, gross sales price 2.90.
    • The average discount rate of 17.4% is taken from the annual planning, as well as the proportional manufacturing costs of 1.02 per piece.
    • If the planned 20’000 units can actually be sold as a result of the promotion, a CM I of 27’400 results. After deduction of the direct costs of the promotion (fixed) in lines 9 and 10, a profit improvement of 13’400 remains.
    • Due to the special discount, the CM I per unit decreases from 1.95 to 1.37. This means that the promotion is profitable if more than 10’219 units are sold at the promotional price (breakeven quantity of the promotion).

In the mentioned simulation model, the available and used capacities are also planned in minutes per cost center. From this evaluation, it can be seen that sufficient free capacity is expected to produce the 20’000 pieces for the promotion in the fall months:

capacity requirements

Capacity requirements

The described action to attract new customers can be carried out. It is worthwhile if slightly more than 50% of the items 105010 produced for the promotion can be sold at the special price. The unsold pieces are still in stock at the end of January at proportional product costs. The chance of persuading new customers to order individually equipped ring binders is intact. Approximately 4 months after the end of the campaign, it should be assessed which new customers have been won and whether they have bought again.

Data basis for simulation models in management accounting

The quantification of planned promotions should show how the results (contribution margins, fixed costs, investments) are likely to change. The prerequisites for this must be created in the operational systems:

    • In the resource planning system (ERP), it must be possible to plan material and working time consumption as well as capacities, sales and net revenues and to track them in actual terms.
    • The management accounting system must be structured as a step-by-step and multidimensional contribution margin accounting system so that the proportional planned product costs and thus the contribution margins to be achieved can be calculated.
    • The new investments to be expected must be taken into account. The previous depreciation costs are not relevant for the decision (sunk costs).