Todays net revenues are largely the result of previous marketing, sales and product management actions. Leads (qualified addresses for persons to be approached in specific companies) are the starting point for presenting an offering to future customers. The presentations should result in requests for proposals or quotes. These, if they are acceptable to the prospects, become incoming orders and ultimately sales. To plan actions, processes and investments in marketing and sales for the next year, leads are therefore important, albeit uncertain, piloting for Market Success variables.
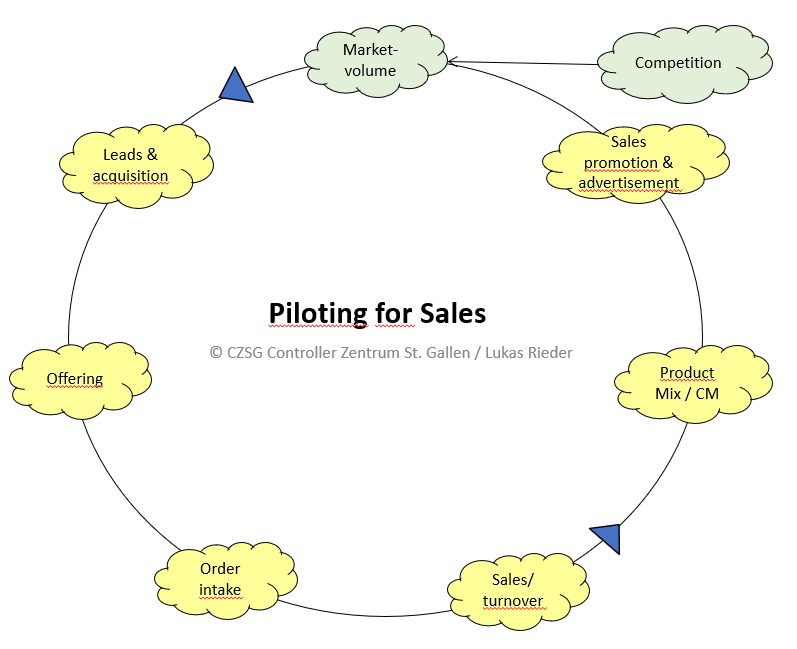
Piloting for Market Success
To be able to recognize and track the developments in business initiation, it is advisable to work with time series analyses. The focus is on various questions:
-
- How many leads are needed on average to receive an invitation for a presentation? For this purpose, the leads procured can be related to the visit invitations, i.e.: number of leads : invitations received, each in relation to one year. Since an acquisition call can be the result of a contact from previous years, the multi-year development of this key figure (moving average) should also be shown. The determination of this key figure requires that the leads and the agreed appointments are recorded in the customer relationship management system (CRM) in terms of content and date.
- The contacts with the prospects (date) and the contents discussed should also be recorded in the CRM system. This makes it possible to evaluate the period between the initial contact and the offer request and to document the contents of the conversation. This makes it easier for the account manager to prepare the next calls.
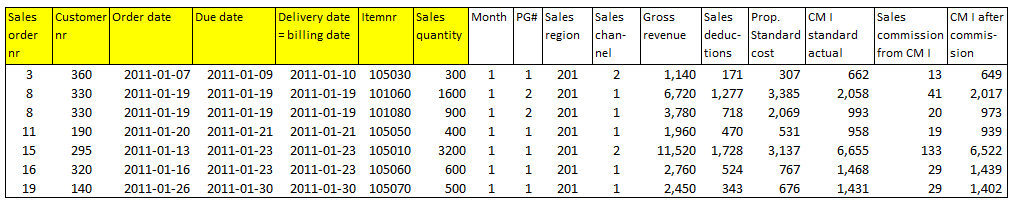
- If the (potential) customer requests a quotation, this should already contain the individual items offered with their prices and conditions in as much detail as possible. In this way, the open quotations can also be taken into account in sales and production planning. The basic data required for this (customer data, article data, discounting rules, payment conditions) is often kept in the ERP system, to which the CRM system is linked.
- Relating the submitted offers/quotations to the number of leads generates more piloting information: A) Evolution of the average time between lead generation and offer over the years. B) How many leads have to be processed on average before an offer can be submitted. These metrics are important for the salesperson’s work planning, as they allow him to estimate how long it takes from the initial contact to the offering and how much working time it takes.
- If an order is received, a comparison of the outgoing quotation and the customer order can be used to determine how many quotations have to be created in order to achieve an order entry and what period lies in between (average values per salesperson, territory, product group).
- If the executed order can be invoiced in the ERP system, the time period between order entry and revenue generation becomes visible. This indicates to the salesperson whether he needs to increase his working time percentage for customer acquisition in order to meet his sales and contribution margin targets.
- Dividing the order backlog by the average monthly sales shows how many production months are covered through the order backlog. If this value falls, this is an indication that customer acquisition must be intensified if sales are not to collapse in the medium term.
In the example below the data preparation and the resulting key figures can be traced over 5 periods (months):
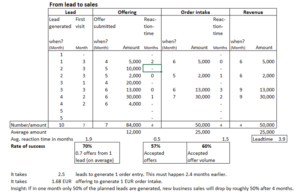
In this example from lead and first visits to sales
-
- 10 leads were received resulting in 7 submitted offers with an average amount of 12,000 after an average of 1.9 months. 70% of the leads were thus successful.
- 4 of the 7 submitted offers were accepted (success rate 57%) resulting in an order intake of 50,000 (success rate 60%). Customers took an average of half a month to accept the offer.
- Sales could be invoiced after 1.5 months on average after order entry. This results in a total lead time from the arrival of the lead to the generation of revenue of 3.9 months.
It takes 2.5 leads (10 : 4) to generate 1 order. On average this takes 2.4 months (1.9 + 0.5). To achieve 1 EUR order entry, an average of 1.68 EUR offer volume is required (84,000 : 50,000). Linking all of the above shows that if only 50% of new leads are generated in one month, the revenue from new customers will also drop by about 50% after about 4 months.
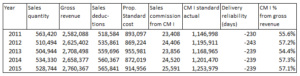
These key figures not only help salespeople manage their workload. Sales promotion and marketing or advertising departments can also use them to determine which actions they should take in the next planning periods. To do this, however, these departments also need to know which products they should focus on promoting by looking at contribution margins per unit. In addition to strategic considerations, contribution margin analysis at the product level is also very important. The main products to be promoted and supported with sales promotion campaigns are those that generate a high contribution margin as a percentage of sales or net income.
Article-related contribution margin accounting (planned and actual) provides the necessary information for this (see the post Contribution Margins to Cover Structure Costs ). In the CM-calculation, it can be calcuated in plan and actual how many cents are left over from one EUR of sales to cover fixed costs and generate profit (EBIT). Advertising and sales promotion should therefore direct their actions towards items whose CM I in % of sales increases over the years or at least remains the same, as the market position allows to enforce higher net sales prices or because the proportional manufacturing costs of these items decrease over the years due to internal process improvements.
All the data elements mentioned in this post stem from internal company data. They help to plan the actions of the near future but have nothing to do with strategy yet. That is why we refer to them as piloting variables.
The cycle described above “from lead to sales” relates primarily to the initiation of profitable business with new customers. The analyses of developments in past years show where the greatest opportunities for success exist and can be seized.
For the successful further growth of the existing and future business, further piloting data must be considered. This is the subject of the post “Analysis of previous sales developments”.